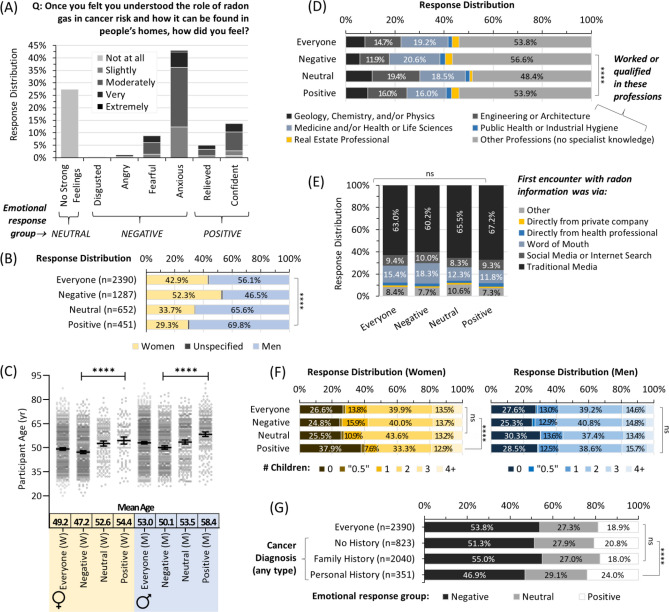
Figure 3.
Emotional reactions to radon awareness vary by personal demographics, but not the first encounter. Panel (A) Overall distribution and Likert scale intensity of emotional responses to gaining awareness of radon health effects and how it can be found in homes. Panel (B) Emotional response distributions from (A) as a function of sex. Panel (C) Emotional response distributions from (A) as a function of sex and age. Mean Age refers to a geometric mean ± CI95%. Panel (D) Emotional response distributions from (A) as a function of status (worked or qualified) in professions with or without the potential for a specialist on radon. Panel (E) Emotional response distributions from (A) as a function of their first encounter with radon awareness information. Panel (F) Emotional response distributions from (A) for parental status of women (left, yellow) and men (right, blue). Panel (G) Emotional response distributions from (A) as a function of experience with a cancer (of any type) diagnosis. Statistical comparisons are Mann–Whitney pairwise nonparametric t-tests of comparisons for scatter plot data or 1-way ANOVA for all other data. **** = p < 0.0001; ns = p > 0.05. Figures were prepared using Excel and GraphPad Prism 9.1.1 (225) (www.graphpad.com).

