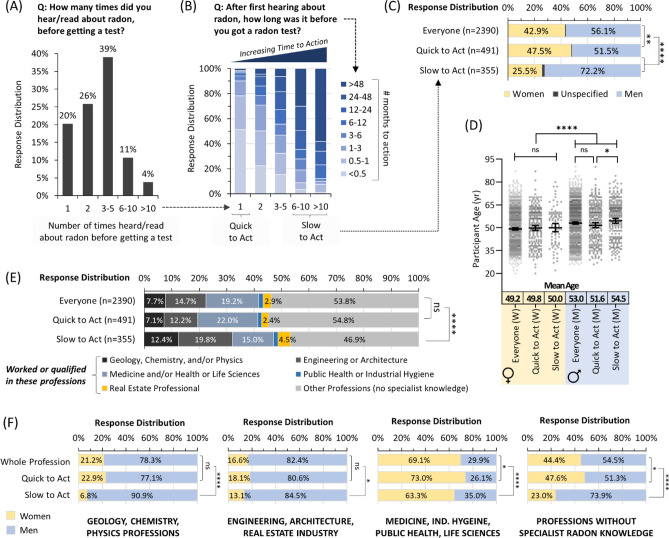
Figure 4.
Time to action following radon awareness diverges strongly by sex and profession. Panel (A) Overall distribution of responses for the number of times people report encountering radon awareness information before obtaining a radon test. Panel (B) The amount of time that people report between first encountering radon awareness information and obtaining a radon test is expressed as a function of data in (A). Panel (C) Time to action (from A,B) as a function of sex. Panel (D) Time to action (from A,B) as a function of sex and age. Mean Age refers to a geometric mean ± CI95%. Panel (E) Time to action (from A,B) as a function of status (worked or qualified) in professions with or without the potential for specialist knowledge on radon. Panel (F) Time to action (from A,B) was expressed as in (C) but split into the professional alignment groups from (E). Statistical comparisons are Mann–Whitney pairwise nonparametric t-tests of comparisons for scatter plot data or 1-way ANOVA for all other data. **** = p < 0.0001; ** = p < 0.01; * = p < 0.05; ns = p > 0.05. Figures were prepared using Excel and GraphPad Prism 9.1.1 (225) (www.graphpad.com).

