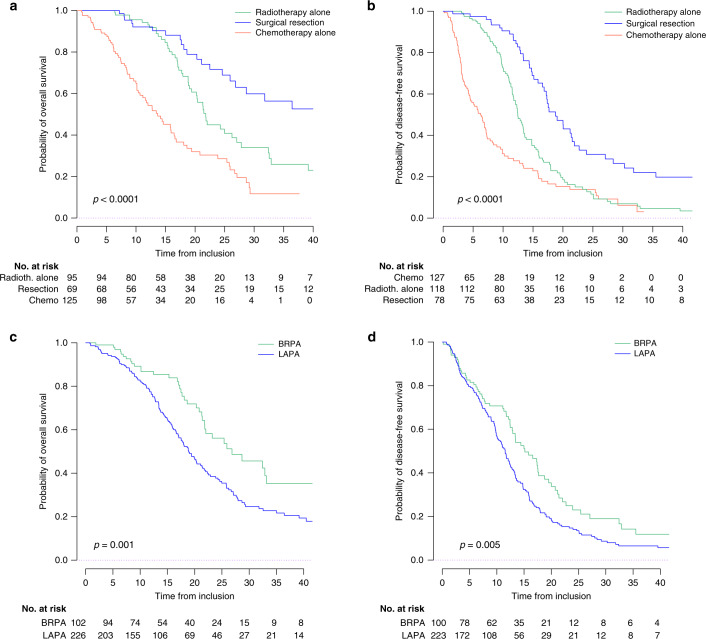
Fig. 2. Survival curves in the overall study population.
Kaplan–Meier curves displaying survival according to the treatment received (a OS, b PFS) and according to the BRPA/LAPA status (c OS, d PFS). BRPA borderline resectable pancreatic adenocarcinoma, LAPA locally advanced pancreatic adenocarcinoma. Number of patients at risk varies due to missing data.

