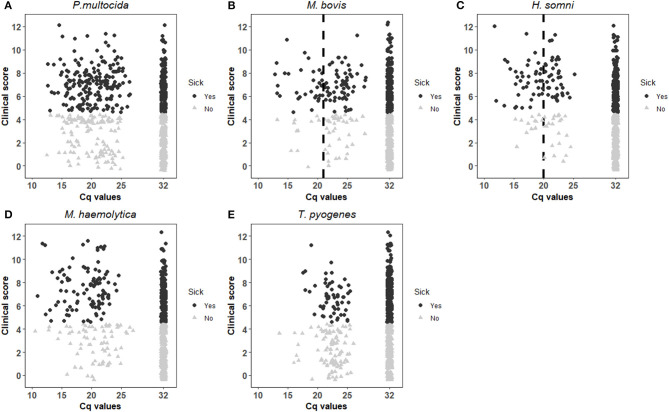
Figure 1.
Distribution of respiratory clinical score against Cq values for P. multocida (A), M. bovis (B), H. somni (C), M. haemolytica (D) and T. pyogenes (E), and additionally grouped by respiratory disease classification with black dots indicating an observation unit sick with respiratory disease and grey triangles indicating a healthy. The vertical dotted lines in (B,C) represent the visually estimated clinically relevant Cq values.

