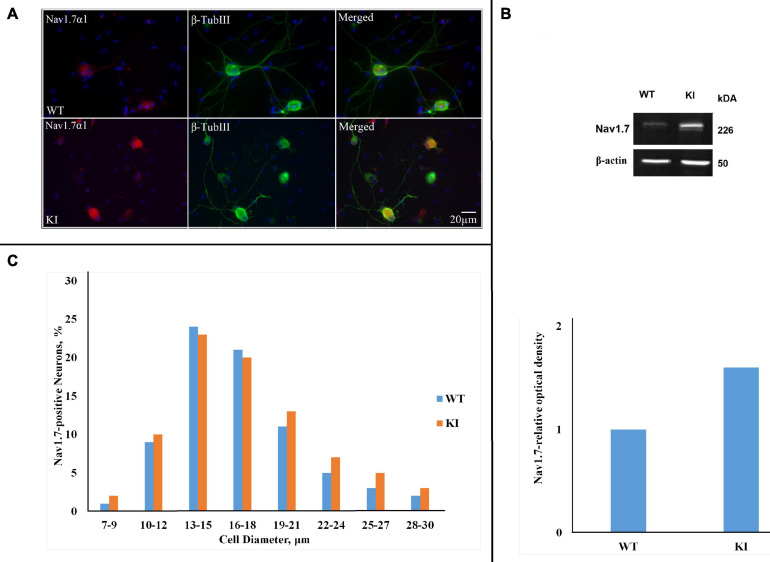
FIGURE 1.
NaV1.7 α1 subunit expression in wild-type (WT) and R192Q KI TG cultures. (A) Representative immunofluorescent examples of NaV1.7 α1 expression in WT and R192Q KI mouse trigeminal ganglia (TG) cultures. Nuclei are visualized with DAPI (blue); scale bar = 20 μm. Note extensive co-staining of NaV1.7 α1 (red) and β-tubulin III (green) protein in both WT and KI samples. (B) Western blot example showing protein expression of NaV1.7 α1 in TG from P12 mice. β-actin was used as a loading control. Histograms representing NaV1.7 α1 relative optical density values for each group (*p = 0.46, Mann-Whitney test; n = 8 experiments). Note the significant difference between WT and KI groups. (C) The histograms quantify the cell diameter distribution of NaV1.7 α1 immunofluorescence in different subgroups of WT and KI cultures (n = 3 experiments). The percentages of positive neurons for NaV1.7 were calculated by considering the total number of neurons labeled by β-Tubulin III as standard.

