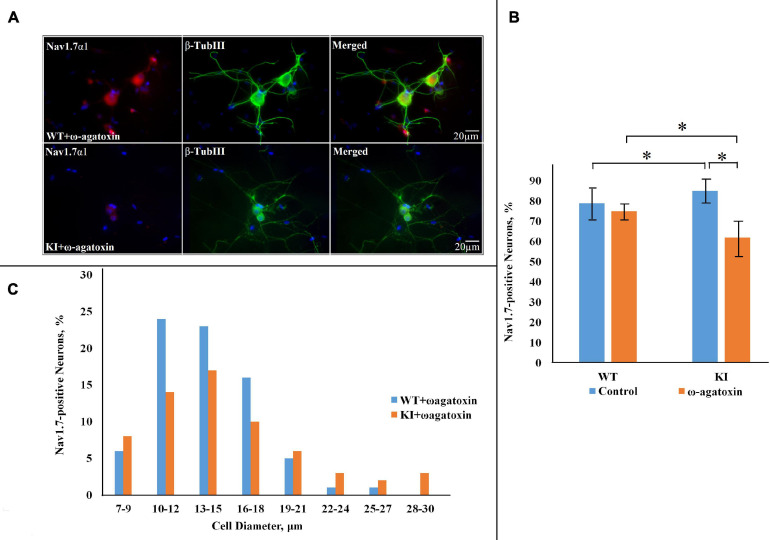
FIGURE 2.
NaV1.7 α1 subunit expression in WT and R192Q KI TG cultures after pretreatment with ω-agatoxin IVA. (A) Representative immunofluorescent examples of NaV1.7 α1 expression in WT and R192Q KI mouse TG cultures. ω-agatoxin IVA (200 nM, overnight: in this and subsequent Figures the toxin is abbreviated as ω-Agatoxin) was used to specifically block CaV2.1 channels (that are mutated in the KI model). Nuclei are visualized with DAPI (blue); scale bar = 20 μm. Note extensive co-staining of NaV1.7 α1 (red) and β-tubulin III (green) protein in both WT and KI samples. (B) Histograms represent the percentage of NaV1.7-positive cells in WT and KI cultures. Note significant difference between WT and KI control groups (*p = 0.015, Mann–Whitney test; n = 7 experiments), and the decrease in NaV1.7 positive neurons in the KI after application of ω-agatoxin IVA (p = 0.035; n = 3 experiments). (C) The histograms quantify the cell diameter distribution of NaV1.7 α1 immunofluorescence in different subgroups in WT and KI ω-agatoxin IVA-treated cultures.

