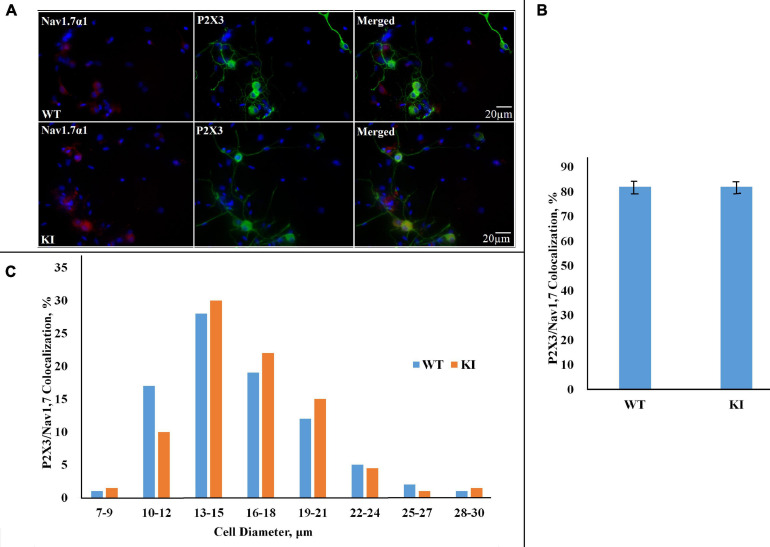
FIGURE 3.
Co-expression of NaV1.7 α1 subunit and P2X3R in WT and R192Q KI cultures. (A) Representative examples of NaV1.7 α1–P2X3 immunostaining in WT and R192Q KI mouse TG cultures. Nuclei are visualized with DAPI (blue); scale bar = 20 μm. Note the extensive co-staining of NaV1.7 α1 (red) and P2X3 (green) protein in both WT and KI samples. (B) Histograms represent percentage co-expression of NaV1.7 α1–P2X3 proteins in WT and KI cultures (p = 0.95, Mann–Whitney test; n = 3 experiments). (C) The histograms quantify the cell diameter distribution of NaV1.7 α1–P2X3R immunofluorescence in different subgroups in WT and KI cultures.

