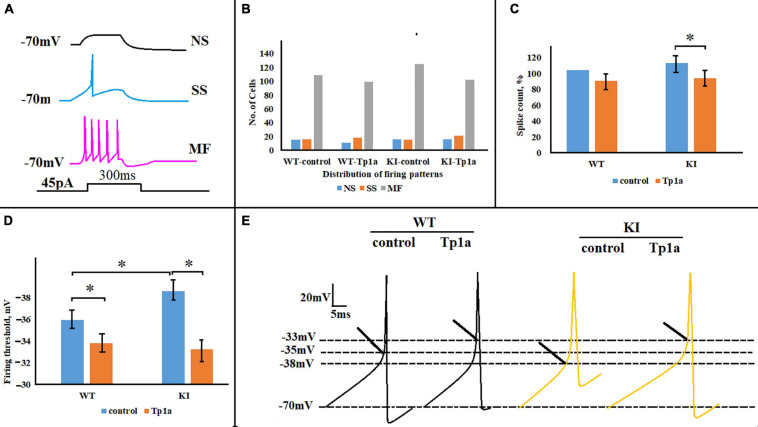
FIGURE 5.
Effects of Tp1a on firing of TG neurons evoked by a 45-pA 300-ms square current pulse. (A) Cell-specific firing patterns recorded from three different WT TG neurons in response to the same stimulation. NS, no-spiking cell; SS, single-spike cell; MF, multiple-firing cell. (B) Distribution of firing patterns in WT and R192Q KI TG cultures is very similar in control and after application of Tp1a (7 nM, 30 min); chi-square test for proportions. Number of cells in each group for NS, SS, and MF cells, respectively: n (WT, control) = 15, 16, 109; n (WT, Tp1a) = 11, 18, 99; n (KI, control) = 16, 15, 125; n (KI, Tp1a) = 16, 21, 102. (C) Histograms represent the percent change of the number of spikes, generated by WT and KI neurons in control and after 30 min application of 7 nM Tp1a. *Indicates statistically significant change (Mann–Whitney test, p-values are given in the text body). Number of cells in each group: n (WT, control) = 109, n (WT, Tp1a) = 99, n (KI, control) = 133, n (KI, Tp1a) = 102. (D) Averaged firing threshold of WT and KI neurons in control and after Tp1a (7 nM, 30 min). *Indicates statistically significant change (two-sample Student’s t-test, p-values are given in the text body). Number of cells is as in (C). Note more negative KI threshold value in control and depolarized WT and KI thresholds after Tp1a application. (E) Representative traces of the first generated AP by WT and KI control and Tp1a-treated (7 nM, 30 min) neurons. Arrows indicate AP threshold.

