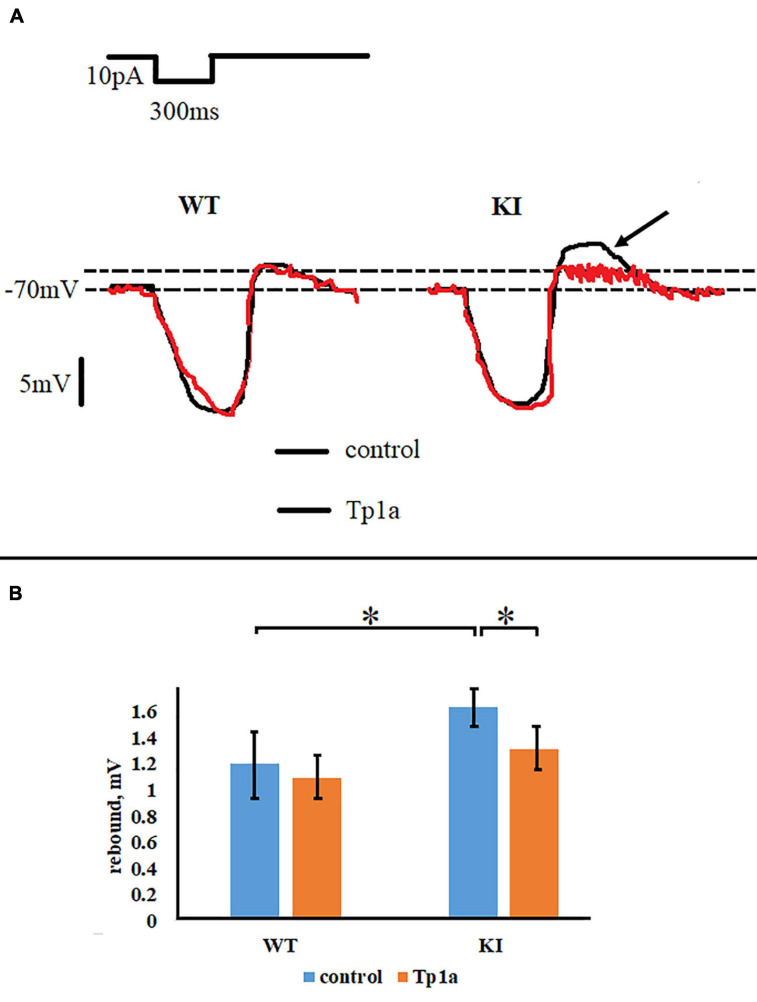
FIGURE 6.
Tp1a reduces rebound effect after a 300-ms hyperpolarizing pulse of 10 pA in R192Q KI TG neurons. (A) Representative responses of WT and R192Q KI neurons, recorded in control and after application of Tp1a (7 nM, 30 min). Arrow shows higher rebound in KI which is reduced by Tp1a. (B) Histograms represent rebound effect in WT and KI neurons under control conditions and after 30 min application of 7 nM Tp1a. *Indicates statistically significant change (two-sample Student’s t-test, p-values are given in the text body). Number of cells in each group: n = 90 (WT, control), n = 86 (WT, Tp1a), n = 109 (KI, control), n = 96 (KI, Tp1a). Note small but statistically significant difference between WT and KI neurons, and a reduction of the rebound effect in KI after Tp1a application.

