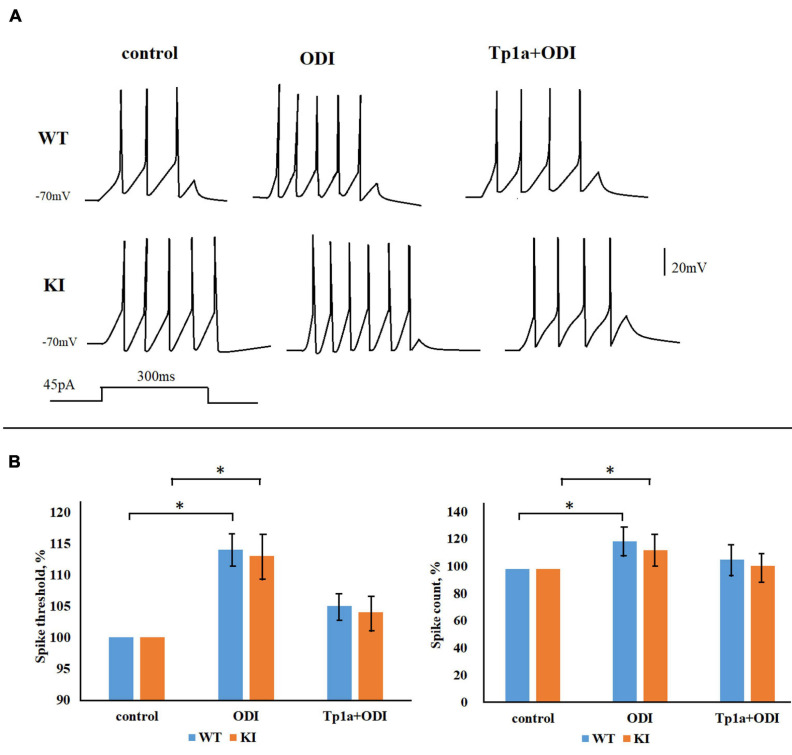
FIGURE 7.
OD1 elevates firing of TG neurons in response to a 45-pA 300-ms square current pulse. (A) Representative traces obtained from WT and R192Q KI TG neurons in control and after application of 10 nM OD1 (paired data, recordings from the same cell) or after application of 10 nM OD1 on cells pretreated with Tp1a (7 nM, 30 min; recordings from different cells). (B) OD1 application makes the AP threshold more negative and increases spike count both in WT and KI neurons (paired data); *Indicates statistically significant change (Mann-Whitney test, p-values are given in the text body). Number of cells in each group: n = 37 (WT, control), n = 36 (WT, OD1), i = 28 (KI, control), n = 25 (KI, OD1). The effect of OD1 is decreased when cells were pretreated with Tp1a (7 nM, 30 min); *Indicates statistically significant change (Mann–Whitney test, p-values are given in the text body).

