FIGURE 8.
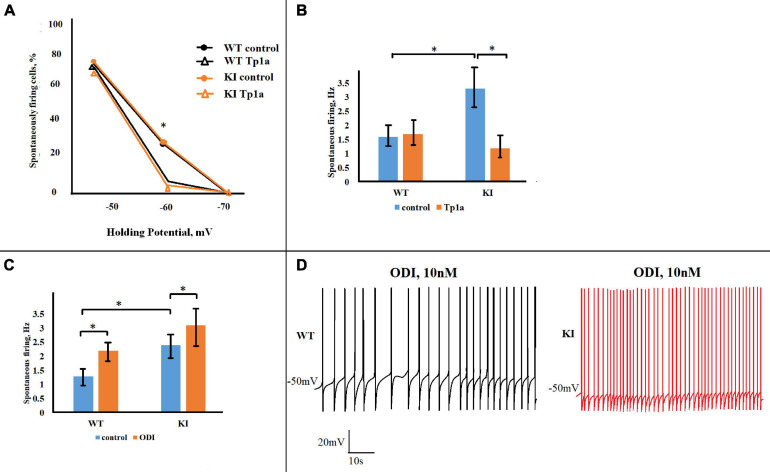
Opposite effects of Tp1a and OD1 on spontaneous firing in TG neurons. (A) Diagram shows percentage of firing WT and R192Q KI TG neurons at different holding potentials in control and after Tp1a (7 nM, 30 min). *Indicates statistically significant change (Fisher test for proportions, p-values are given in the text body). Number of analyzed neurons at –70, –60, and –50 mV, respectively, are: n (WT, control) = 40, 40, 40; n (WT, Tp1a) = 32, 32, 31; n (KI, control) = 42, 42, 37; n (KI, Tp1a) = 33, 33, 33. (B) Bar charts represent average firing frequencies of WT and KI neurons in control and after Tp1a (7 nM, 30 min). *Indicates statistically significant change (paired Student’s t-test, p-values are given in the text body). Number of cells in each group: n = 31 (WT, control), n = 30 (WT, Tp1a), n = 23 (KI, control), n = 23 (KI, Tp1a). KI neurons fire with significantly higher frequency, which is reduced to the WT level after Tp1a application. (C) Application of 10 nM OD1 (paired data, recordings from the same cell) increases firing frequency of both WT and KI neurons at –50 mV. *Indicates statistically significant change (paired Student’s t-test, p-values are given in the text). Number of cells in each group: n = 17 (WT), n = 10 (KI), data are paired. (D) Examples of WT and KI neurons, firing at –50 mV before and after application of 10 nM OD1.

