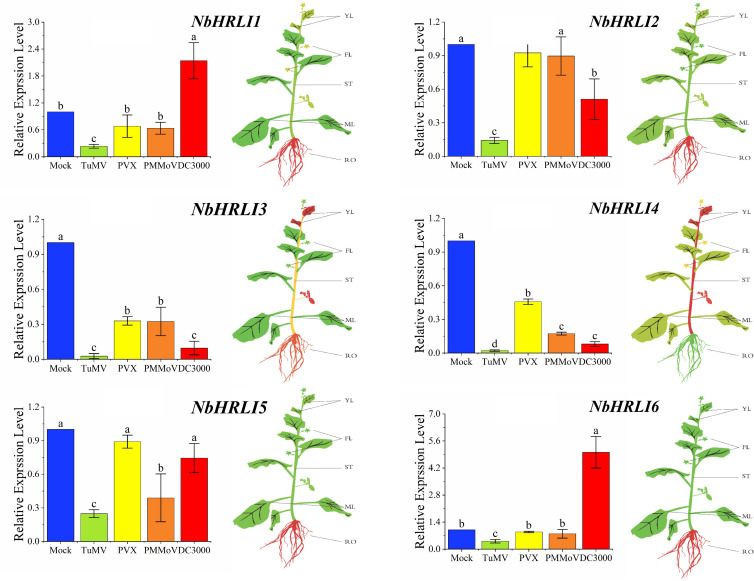
FIGURE 2.
The differential expression of NbHRLIs infected with different pathogens and in different tissues by RT-qPCR. YL, young leaf; MF, mature leaf; ST, stem; RO, root; FL, flower. The mean expression values were visualized by TBtools; red represents high expression level and green represents low expression level. N. benthamiana was mechanically inoculated with TuMV, PVX, and PMMoV and harvested at 5 dpi. N. benthamiana were infiltrated with a suspension of Pst DC3000 (OD600 = 10–5) in 10 mM of MgCl2 and harvested at 1.5 dpi. The mean expression values were analyzed using F-test. Different letters on histograms indicate significant differences (P < 0.05).

