Figure 1.
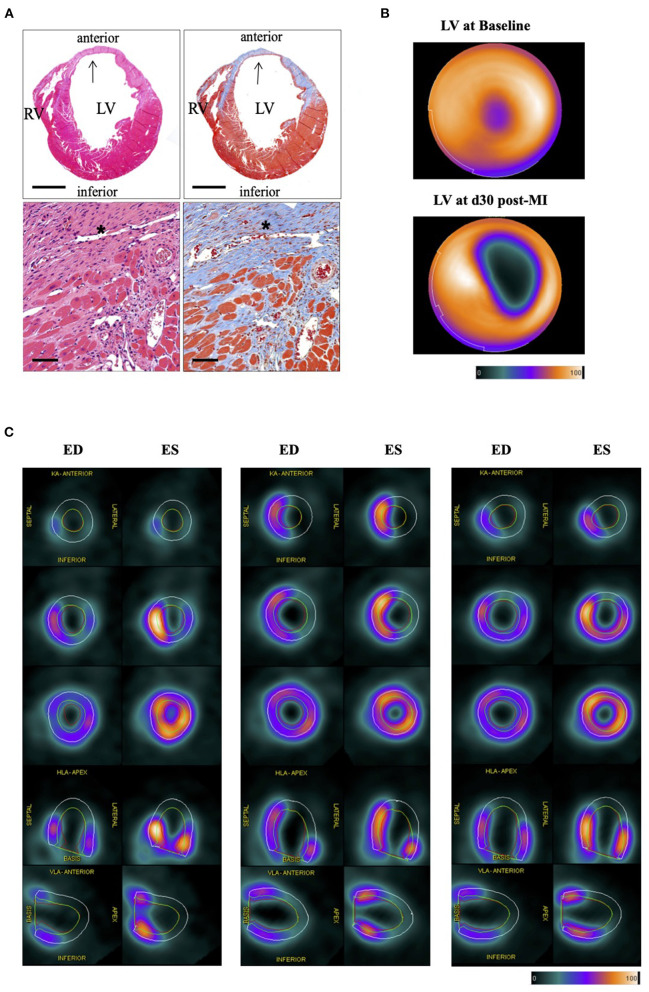
Histological and PET imaging of murine myocardial infarction. (A) Histology section of the heart 30 days after LAD ligation. HE-Staining (left) and Masson's trichrome staining (right). Stars and arrows indicate the magnified infarct scare area in the left ventricular (LV) wall (blue). Right ventricle (RV). Bar equals 100 and 50 μm, respectively. (B) Representative bulls-eye image of the left ventricle of healthy (upper image) and infarcted left ventricle (lower image) showing the defect of the infarct. Color Scale from QPS: Cool and in percentage range. (C) Panel shows PET images of three representative infarct hearts (left, middle, and right panel) each in end-diastole (ED) and end-systole (ES) in different axes at various levels of the left ventricle. ED volume (green line) and ES volume (red line) depicting the motion deficit in the infarct area (KA, coronary axis; VLA, vertical long axis; HLA, horizontal long axis). EF% from left to right: 40%, 34%, 42% (QGS); Defect% (QPS) from left to right: 48%, 44%, 40%. Color Scale from QGS: Cool as used in (B). For the segmental defect and motion deficit of the three representative mice, please see Supplementary Figures 2A,B, respectively.

