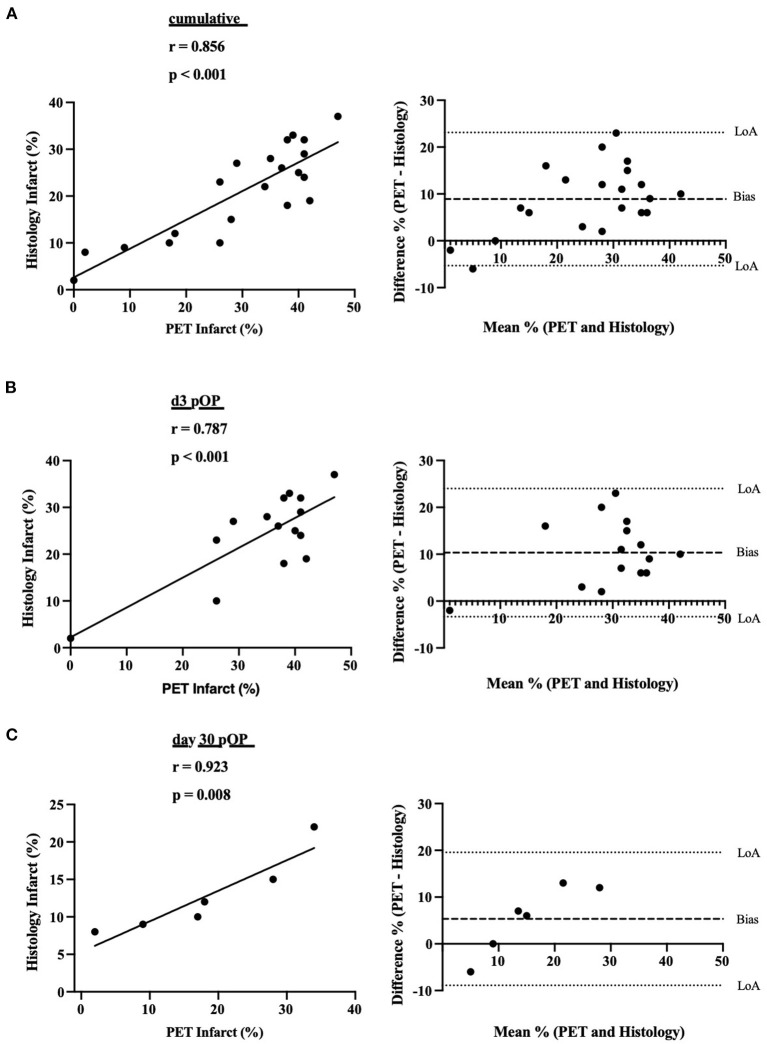
Figure 2.
Scatter plots of the correlation between histological and PET infarct areas. (A) Cumulative correlations between histological and PET infarct area (in %). Corresponding Bland-Altman-plot on the right side. Dotted lines display the Limits of agreement (LoA) and correlation line. Dashed lines indicate bias. (B) Correlations between histological and PET infarct area (in %) at day 3 post-MI. Corresponding Bland-Altman-plot on the right side. (C) Correlations between histological and PET infarct area (in %) at day 30 post-MI. Corresponding Bland-Altman-plot on the right side.

