Abstract
Objectives:
Peripheral quantitative computed tomography is utilised in increasing numbers of paediatric studies, however, very little is known about the reference limits for pQCT tibia measurements. The purpose of this study was to establish country-specific reference data for bone densities, cross-sectional sizes, strength and regional muscle distribution measured by pQCT in children and adolescents.
Methods:
Stratec XCT 2000L apparatus was used. The measurement sites were 4%, 14%, 38% and 66% of the tibia length. The study group consisted of 222 participants (103 girls) aged 4,3-19,4 yrs. ANCOVA was used to assess the main determinants of pQCT outcomes. The LMS method was used to fit the percentile curves for each outcomes.
Results:
Weight and age were the main determinants for most of the pQCT outcomes. Smoothed percentile curves were developed by age and by height for both sexes.
Conclusion:
In this study we present reference data for bone densities, cross-sectional size and strength as well as for regional muscle distribution measured by pQCT at certain sites of the lower leg to allow simple calculation of reliable Z scores.
Keywords: Children, Lower Leg, pQCT, Reference Data, Tibia
Introduction
Bone densitometry methods are gaining popularity in the field of paediatrics. Among them, peripheral quantitative computed tomography (pQCT) allows to measure true volumetric bone mineral density, separately for trabecular and cortical compartments of the bone. Bone dimensions and strength could also be determined as well as fat and muscle areas in certain slices of the extremities[1-3]. Providing both information about the bone and the muscle, the pQCT method allows assessment of the functional muscle-bone unit[4,5]. Finally, pQCT scans deliver only a very low radiation dose and avoid systemic irradiation[1,2], i.e. the effective dose for the patient is less than the dose received daily from natural sources of radiation[6].
Until now, most of the studies presenting normative data by pQCT in children utilize the forearm due to its easy availability[7]. However, forearm measurements are more prone to non-voluntary movements compared to the lower leg. Moreover, the lower leg is marked by a larger bone size and muscle area which make measurements less prone to the partial volume effect[8] and a higher rate of bone turnover secondary to greater mechanical loading[9,10] which may make this site more sensitive to evaluate response to lifestyle change, disease, treatment, etc.
Until now, there is no world-wide reference data set for the lower leg measurements by pQCT[11] and very little is known about bone mineral density, bone cross-sectional area, bone size and mass reference limits[3,7]. Only 3 studies provide local reference data for Belgian[12], South Dakota[13] and Salt Lake City populations[14]. Methodological differences between these studies exist as well as the differences in studied populations (ethnicity, origins) which limit the application of these reference data in other countries/populations. Country-specific reference data are therefore needed.
The purpose of this study was to develop country-specific reference data for the various pQCT parameters in children and adolescents aged 5-19 yrs and to identify predictors for bone densities, cross-sectional size and strength as well as regional muscle distribution measured by pQCT at the lower leg.
Materials and Methods
Studied group
The study group included 222 children and adolescents (103 girls) aged 4,3-19,4 yrs. Participants were recruited from Warsaw area preschools and schools. The inclusion criteria were as follows: age from 4,3 to 19,5 yrs, body height between 5th and 95th percentile, body weight between 5th and 90th percentile and body mass index between 5th and 85th percentile, based on the Polish growth references for school and preschool children[15,16]. The exclusion criteria were: presence of the disease which may affect bone metabolism and more than 2 previous fractures. 314 children and adolescents declared to participate in the study, 93 of them did not fit inclusion criteria or met exclusion criteria.
The protocol was approved by the local Institutional Review Board, no. 61/KBE/2013. Informed written consents were obtained from participants and their parents or legal guardians. Characteristics of the studied group is presented in Table 1.
Table 1.
Anthropometric characteristics of studied group.
| Median | Minimum | Maximum | Q1 | Q3 | |
|---|---|---|---|---|---|
| Female (n=103) | |||||
| Age [yrs] | 11,7 | 4,8 | 19,4 | 8,6 | 15,4 |
| Height [cm] | 154,0 | 110,0 | 173,0 | 135,0 | 163,0 |
| Weight [kg] | 42,5 | 17,0 | 69,0 | 27,2 | 53,0 |
| BMI [kg/m2] | 17,8 | 13,4 | 23,9 | 15,8 | 19,7 |
| Height Z-score | 0,21 | -1,50 | 1,56 | -0,40 | 0,84 |
| Weight Z-score | -0,06 | -1,49 | 1,22 | -0,35 | 0,39 |
| BMI Z-score | -0,15 | -1,63 | 0,98 | -0,74 | 0,37 |
| Male (n=119) | |||||
| Age [yrs] | 11,6 | 4,3 | 19,3 | 7,8 | 15,4 |
| Height [cm] | 152,0 | 106,0 | 187,0 | 130,0 | 177,0 |
| Weight [kg] | 42,0 | 16,5 | 88,0 | 25,0 | 60,8 |
| BMI [kg/m2] | 17,4 | 14,0 | 25,3 | 15,6 | 19,9 |
| Height Z-score | 0,17 | -1,53 | 1,57 | -0,44 | 0,67 |
| Weight Z-score | -0,13 | -1,46 | 1,28 | -0,55 | 0,35 |
| BMI Z-score | -0,26 | -1,62 | 1,03 | -0,76 | 0,31 |
BMI – body mass index.
Measurement
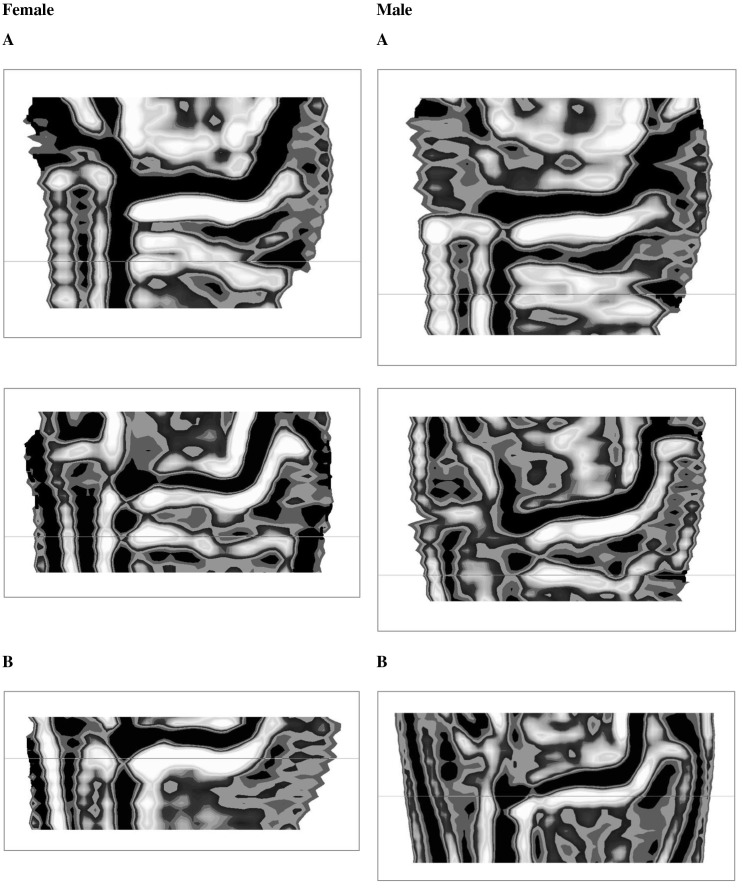
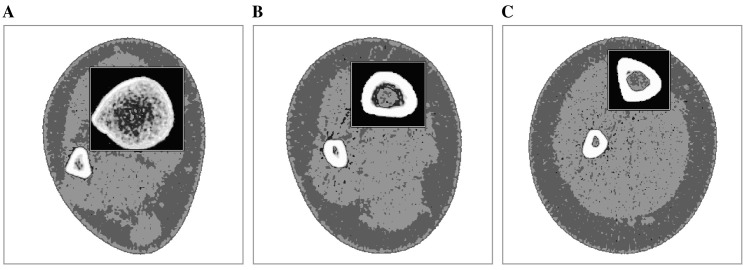
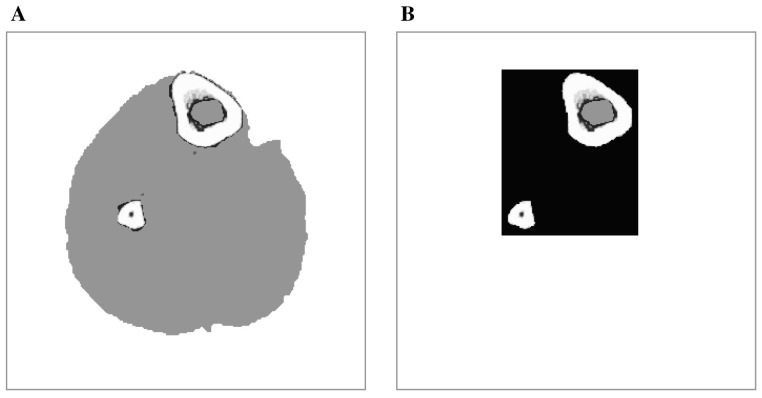
All measurements were done with the Stratec XCT 2000L (Stratec Medizintechnik, Pforzheim, Germany) apparatus, software ver. 6.20, on non-dominant leg[6]. Dominance was determined by the participant’s report. The measurement sites were 4%, 14%, 38% and 66% of the length of the tibia[6]. The tibia length was measured with the ruler from the middle of the inner ankle to the tibial plateau[6]. The scout view was used to determine the start position as follows: if the growth plate was visible the reference line was placed in the middle of the growth plate; if the growth plate had fused the reference line was placed in the middle of the distal end of the tibia (Figure 1). The scan lines were automatically placed at a distances of 4%, 14%, 38% and 66% of the tibia length, proximal to the reference line. Scan speed, slice thickness and voxel size were 20 mm/s, 2,3 mm and 0,4x0,4 mm, respectively[6]. At the 4% site trabecular volumetric bone mineral density (mg/cm3), total volumetric bone mineral density (mg/cm3) and total bone cross-sectional area (mm2) were measured with using the CALCBD analysis algorithm, contour mode 1, peel mode 1 and threshold 181 mg/cm3. Area was set as 45% (central) for trabecular volumetric bone mineral density determination[6]. At the 14% and 38% sites the CORTBD algorithm with separation mode 1 and threshold 711 mg/cm3 was used for determining cortical volumetric bone mineral density (mg/cm3) and cortical cross-sectional area (mm2), while threshold 280 mg/cm3 was used for polar strength strain index (mm3) calculation. The same threshold (280 mg/cm3) with the contour mode 1 and peel mode 1 was used for total bone cross-sectional area (mm2) determination (Figure 2)[6]. At the 66% site the CALCBD algorithm was used, with threshold 40 mg/cm3, contour mode 3, peel mode 1 and filter F03F05 for muscle+bone area; threshold 280 mg/cm3 and contour mode1, peel mode 2 for bone area[6]. Muscle cross-sectional area (mm2) was calculated by the subtraction of bone cross-sectional area from muscle+bone cross-sectional area (Figure 3). Bone mass, per 1 running centimetre of bone in the particular slice was calculated from its density and cross-sectional area[6]. Outer cortical bone circumference, inner cortical bone circumference and cortical shell thickness were calculated basing on the circular ring model[17]. Finally, the following ratios were calculated: tibia 14% cortical bone cross-sectional area to tibia 4% total bone cross-sectional area and tibia 4% bone mass to tibia 38% bone mass as a measures of the longwise bone shape[6] and lower leg 66% total cortical cross-sectional area to muscle cross-sectional area as a measure of the bone/muscle relationship[4,5].
Figure 1.
Scheme of the determination of the start position: left panel refers to female, right to male; A – the growth plate is visible, B – the growth plate is fused; line - reference line (the start position).
Figure 2.
Cross-sectional images of left lower leg: A - “4%” site, B - “14%” site, C - “38%” site; box indicates tibial bone.
Figure 3.
Scheme of the determination of muscle cross-sectional area (66% length of the lower leg); A – “muscle+bone area”, B – “bone area”; black box is applied to increase visibility of the bones.Muscle area = “muscle+bone area” minus “bone area”.
The effective doses involved in the procedure are as follows: scout view: 0,08 microSv; CT scans at 4%, 14%, 38 and 66% sites: 0,88 microSv (4 x 0,22 microSv); total dose: 0,96 microSv[6].
All measurements were done between May 2013 and Jun 2016 by the same operator on the same unit. The quality of each slice was rated from 1 (no movement) to 5 (extreme movement) by the same operator, according to the visual scale[18]. Slices rated >3 were excluded from the analysis as suggested by the others[18]. In the case of 4% of the tibia length site 4 measurement were excluded, 3 exclusions were done for 14% site as well as for 38% and no exclusion was done for 66% site. Routine quality assurance procedures were carried out, basing on the phantom supplied by the manufacturer. The phantom comprises two “parts”: standard and cone. The standard phantom was measured each day when patients were measured. The cone phantom was measured monthly. Measurement errors were (CV%, standard phantom): 0,35% for total density, 0,44% for trabecular density and 0,37% for cortical density in the study period.
Body weight and height were measured in the standing position using medical scale with stadiometer (Tryb, Bydgoszcz, Poland). Body mass index was calculated as body weight divided by height in meters squared. Age of each participant was calculated from birth and observation dates.
Statistics
The normality of the distribution of analyzed variables was assessed by Shapiro-Wilk test. Analysis of covariance was carried out with sex, age, height, weight and BMI as independent predictors of pQCT outcomes. Forward stepwise multiple regression analysis was performed, R2 were calculated for whole model as well as for partial correlations. Due to skewness and heteroscedascity of the data, all variables were transformed with Box-Cox transformation prior to analysis. Data were analyzed using Statistica v 10.0 (Statsoft, Tulsa, USA).
The LMS method[19] was used to fit the percentile curves for each outcome in both sexes. LMSchart-maker v. 2.54 (Medical Research Council, UK)[20] was used to derive the smoothed percentile curves. The LMS method uses polynomial splines to fit smoothed curves: L (Box-Cox transformation power), M (median), and S (coefficient of variation) across ages by maximized penalized likelihood[21]. The smoothed percentile estimates and the L, M, and S parameters were derived from the raw data, separately for each outcome and sex, in a single stage modelling. Prior to modelling, visual inspection of the data was carried out. Data were plotted against age, muscle area and height. Small amount of outliers were excluded, separately for each outcome. Average number of exclusion was 2,1 per outcome, which constitutes 0,96% of the analysed data. The maximum number of exclusion was 4, for 38% tibial cortical bone mineral density and for 38% polar SSI in girls, both by height. Finally, data were modelled by age from 4,8 to 19,4 yrs in girls and from 4,3 to 19,3 in boys and truncated to 5,0-19,0 yrs as suggested by others[22], since the method of penalized likelihood estimation could be imprecise at the ends of the series. Similarly, references by muscle area in girls were modelled from 1956 mm2 to 7525 mm2 and truncated to 2000-7500 mm2, and in boys from 1961 mm2 to 9008 mm2 and truncated to 2000-9000 mm2. References by height in girls were modelled from 110 cm to 173 cm and truncated to 110-172 cm, and in boys modelled from 106 cm to 187 cm and truncated to 110-185 cm. For practical purposes the L, M and S curves were fitted with polynomials. To avoid the imprecision of calculation of the L, M and S values from the fitted curves, the degree of polynomial was selected to achieve R2 value at least 0,999. The upper limit of the degree was set to 6. In the case of tibia 66% total cortical bone cross-sectional area to muscle cross-sectional area ratio by age in girls (M curve), tibia 14% cortical bone cross-sectional area to tibia 4% total bone cross-sectional area ratio by age in boys (M curve), tibia 14% cortical shell thickness by height in boys (S curve), tibia 4% total bone density by height in boys (M curve) and tibia 14% cortical shell thickness by height in girls (S curve) the 6th degree polynomials showed R2=0,9962, 0,9986, 0,9988, 0,9985 and 0,9847, respectively, which were considered as sufficient.
Results
The covariance analysis was carried out to establish anthropometric determinants of the pQCT outcomes. Sex, age, height, weight and BMI were set as independent variables. Results were summarised in Table 2. Bone mineral densities were poor to moderately determined by anthropometric parameters. Coefficients of determinations were from 0,24 to 0,70 for 4% total bone density and 14% cortical bone density, respectively. Age and sex were main and independent predictors of total and cortical bone mineral densities while trabecular bone density at the 4% of the tibia length was determined by body mass index, sex and age. Bone masses (at 4%, 14% and 38% sites) were strongly and equally (R2 from 0,92 to 0,93) determined by weight and sex. Bone cross-sectional dimensions at the 38% of the tibia were strongly determined by weight and sex (R2 from 0,83 to 0,91 for cortical shell thickness and cortical bone cross-sectional area, respectively) with exception of inner cortical bone circumference which was determined only by height with coefficient of determination equals 0,62. Determinants of bone cross-sectional dimensions at the 14% of the tibia length were more heterogeneous. Outer cortical bone circumference and total bone cross-sectional area were determined by weight (R2 0,85 for both), inner cortical bone circumference and cortical bone cross-sectional area by weight and sex (R2 0,68 and 0,91, respectively) while cortical shell thickness was determined by age and sex, with R2 equals 0,72. Total bone cross-sectional area at 4% site was determined by age, body mass index and sex (R2 0,83). Longitudinal shape indexes as well as lower leg 66% total cortical bone cross-sectional area to muscle cross-sectional area ratio were poorly determined by anthropometric factors. Determinants were body mass index and sex for tibia 4% bone mass to tibia 38% bone mass ratio, sex for tibia 14% cortical bone cross-sectional area to tibia 4% total bone cross-sectional area ratio and height for lower leg 66% total cortical bone cross-sectional area to muscle cross-sectional area ratio, R2 were 0,10, 0,08 and 0,02, respectively. Polar strength strain indexes at 14% and 38% of the tibia length were strongly determined by weight in the first site and by weight and sex in the second (R2 0,92 for both) as well as lower leg muscle cross-sectional area at 66% site by weight and sex, with R2 equals 0,93.
Table 2.
Predictors of tibia bone outcomes.
| Model | p value for model | Model R2 | Partial R2 | p values for partial R2* | |
|---|---|---|---|---|---|
| Bone mineral densities: | |||||
| tibia 4% trabecular bone density | BMI + sex + age | <0,000001 | 0,36 | 0,07; 0,06; 0,03 | 0,01 |
| tibia 4% total bone density | age + sex | <0,000001 | 0,24 | 0,17; 0,11 | <0,000001 |
| tibia 14% cortical bone density | age + sex | <0,000001 | 0,70 | 0,69; 0,07 | <0,0001 |
| tibia 38% cortical bone density | age + sex | <0,000001 | 0,58 | 0,52; 0,20 | <0,000001 |
| Bone masses: | |||||
| tibia 4% bone mass | weight + sex | <0,000001 | 0,92 | 0,92; 0,07 | <0,0001 |
| tibia 14% bone mass | weight + sex | <0,000001 | 0,93 | 0,93; 0,05 | <0,01 |
| tibia 38% bone mass | weight + sex | <0,000001 | 0,93 | 0,93; 0,03 | <0,01 |
| Cross-sectional bone dimensions: | |||||
| tibia 14% inner cortical bone circumference | weight + sex | <0,000001 | 0,68 | 0,68; 0,03 | <0,01 |
| tibia 38% inner cortical bone circumference | height | <0,000001 | 0,62 | 0,62 | <0,000001 |
| tibia 14% outer cortical bone circumference | weight | <0,000001 | 0,85 | 0,85 | <0,000001 |
| tibia 38% outer cortical bone circumference | weight + sex | <0,000001 | 0,90 | 0,90; 0,07 | 0,0001 |
| tibia 14% cortical shell thickness | age + sex | <0,000001 | 0,72 | 0,70; 0,20 | 0,000001 |
| tibia 38% cortical shell thickness | weight + sex | <0,000001 | 0,83 | 0,83; 0,07 | <0,001 |
| tibia 14% cortical bone cross-sectional area | weight + sex | <0,000001 | 0,91 | 0,90; 0,13 | 0,000001 |
| tibia 38% cortical bone cross-sectional area | weight + sex | <0,000001 | 0,91 | 0,91; 0,10 | 0,000001 |
| tibia 4% total bone cross-sectional area | age + BMI + sex | <0,000001 | 0,83 | 0,51; 0,09; 0,03 | 0,02 |
| tibia 14% total bone cross-sectional area | weight | <0,000001 | 0,85 | 0,85 | <0,000001 |
| tibia 38% total bone cross-sectional area | weight + sex | <0,000001 | 0,90 | 0,90; 0,07 | <0,0001 |
| Longitudinal shape indexes: | |||||
| tibia 4% bone mass/tibia 38% bone mass | BMI + sex | <0,00001 | 0,10 | 0,06; 0,05 | <0,01 |
| tibia 14% cortical bone cross-sectional area/tibia 4% total bone cross-sectional area | sex | <0,0001 | 0,08 | 0,08 | <0,0001 |
| Strength strain index: | |||||
| tibia 14% polar SSI | weight | <0,000001 | 0,92 | 0,92 | <0,000001 |
| tibia 38% polar SSI | weight + sex | <0,000001 | 0,92 | 0,92; 0,02 | <0,05 |
| Muscle and bone: | |||||
| lower leg 66% muscle cross-sectional area | weight + sex | <0,000001 | 0,93 | 0,93; 0,02 | <0,05 |
| lower leg 66% total cortical bone cross-sectional area/muscle cross-sectional area | height | <0,05 | 0,02 | 0,02 | <0,05 |
* - the highest p value was presented.
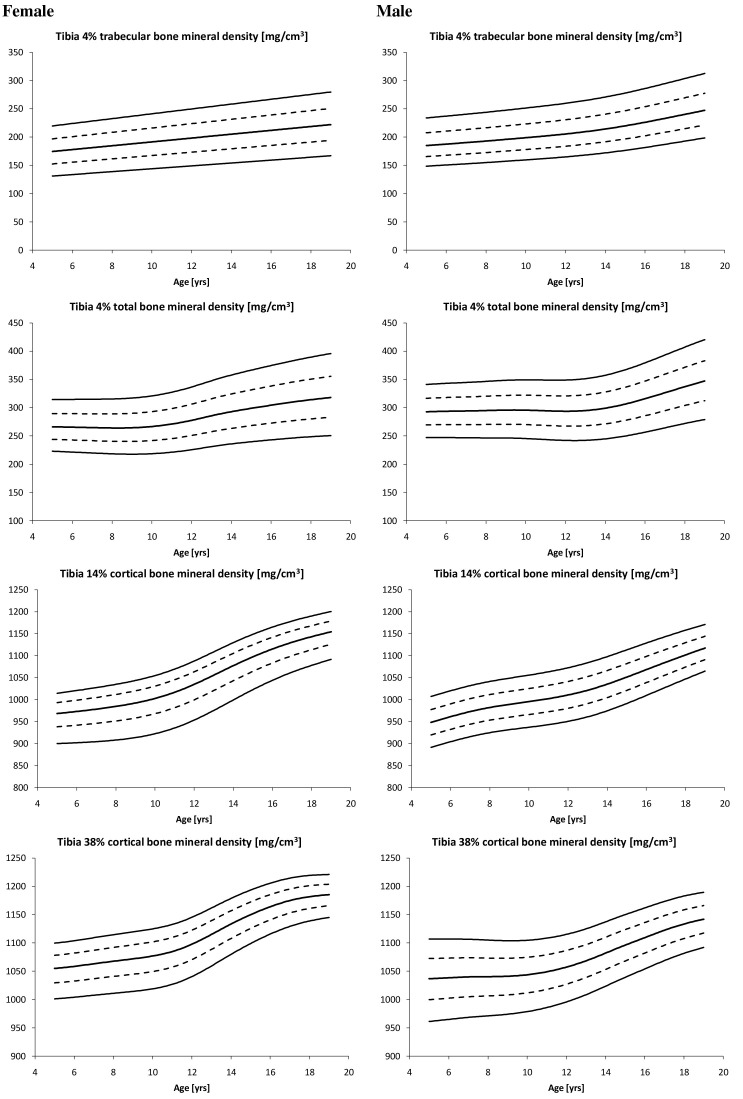
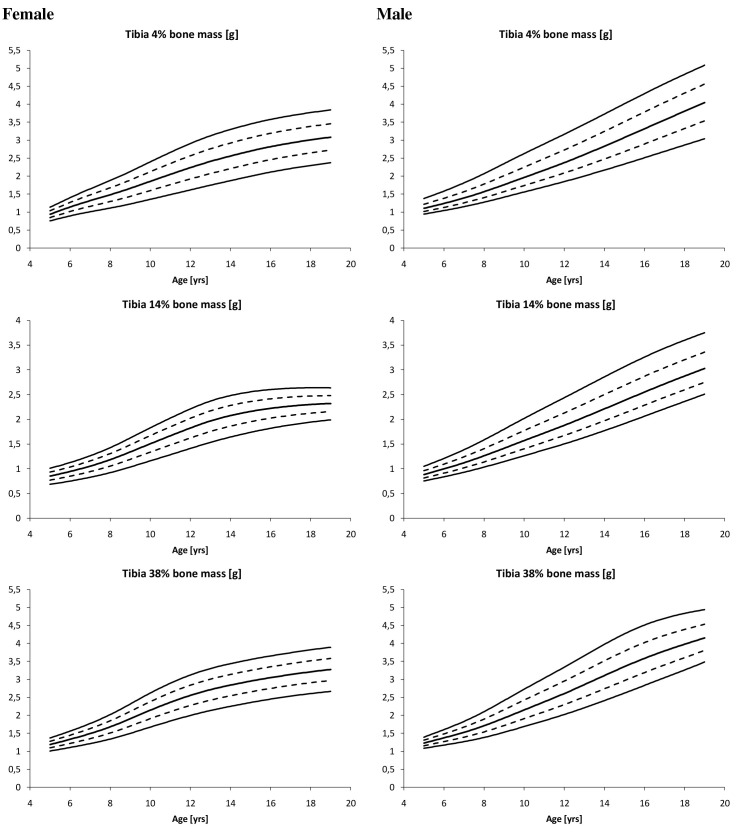
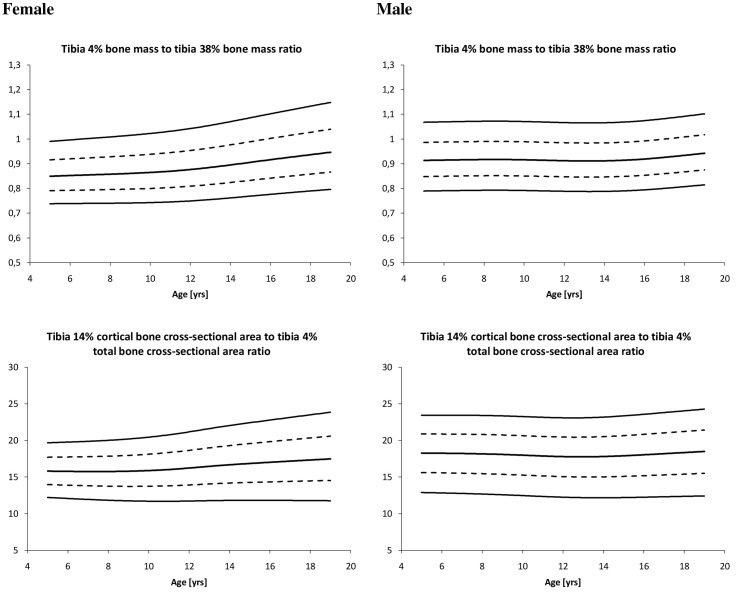
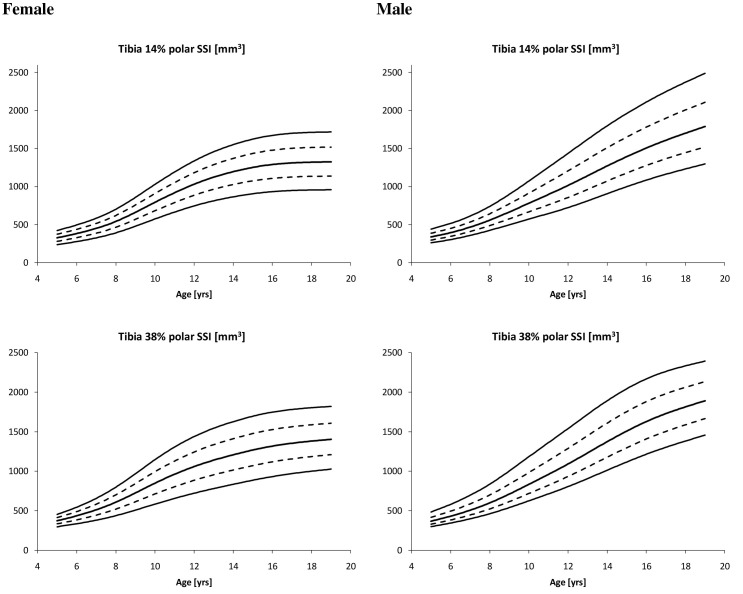
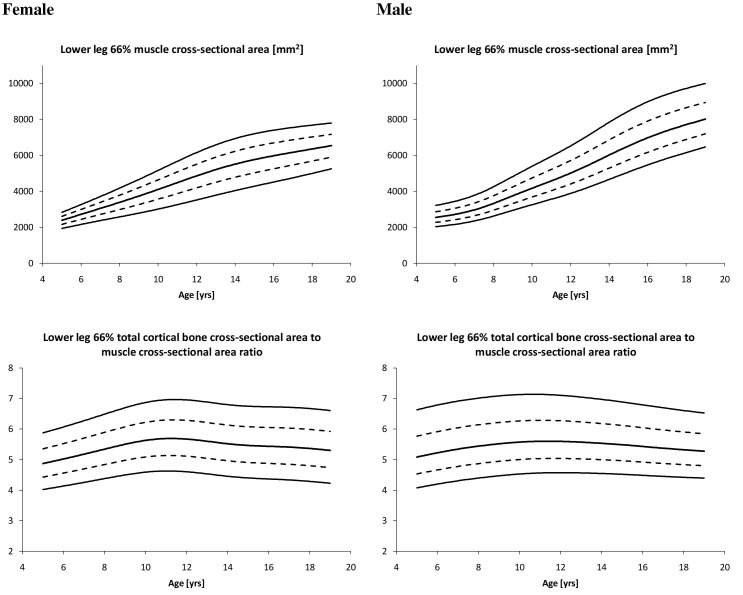
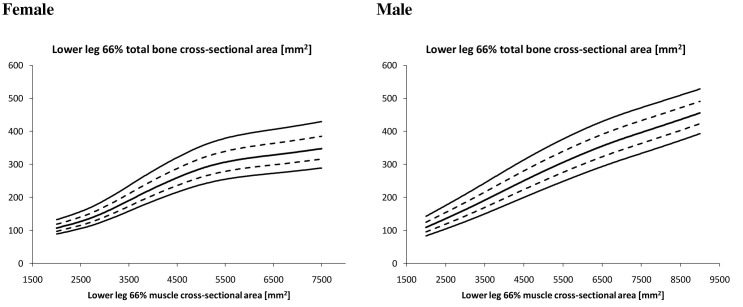
Age- and sex-specific reference ranges for pQCT outcomes are shown graphically in Figures 4, 5, 6, 7, 8 and 9 for bone densities, bone masses, cross-sectional bone dimensions, longitudinal shape indexes, strength strain indexes and muscle and bone, respectively. The reference ranges for the lower leg bone cross-sectional area by muscle area are presented in Figure 10. The median and percentiles corresponding to +/-1 SD and +/- 2 SD were drawn. The equations for L, M and S curves by age, muscle area and height are presented in Tables 3, 4, 5, 6 and 7.
Figure 4.
Reference ranges for bone densities at 4%, 14% and 38% of the length of the tibia by age. Left panel refers to female and right to male. Median (solid line in the middle) and percentiles corresponding to +/-1 SD (dashed lines) and +/- 2 SD (outer solid lines) were presented.
Figure 5.
Reference ranges for bone masses at 4%, 14% and 38% of the length of the tibia by age. Left panel refers to female and right to male. Median (solid line in the middle) and percentiles corresponding to +/-1 SD (dashed lines) and +/- 2 SD (outer solid lines) were presented.
Figure 6.

Reference ranges for cross-sectional bone dimensions of the tibia at 14% and 38% of its length by age. Left panel refers to female and right to male. Median (solid line in the middle) and percentiles corresponding to +/-1 SD (dashed lines) and +/- 2 SD (outer solid lines) were presented.
Figure 7.
Reference ranges for longitudinal shape indexes of the tibia by age. Left panel refers to female and right to male. Median (solid line in the middle) and percentiles corresponding to +/-1 SD (dashed lines) and +/- 2 SD (outer solid lines) were presented.
Figure 8.
Reference ranges for strength strain indexes at 14% and 38% of the tibia length by age. Left panel re-fers to female and right to male. Median (solid line in the middle) and percentiles corresponding to +/-1 SD (dashed lines) and +/- 2 SD (outer solid lines) were presented.
Figure 9.
Reference ranges for muscle and bone outcomes by age. Left panel refers to female and right to male. Median (solid line in the middle) and percentiles corresponding to +/-1 SD (dashed lines) and +/- 2 SD (outer solid lines) were presented.
Figure 10.
Reference ranges for the lower leg bone cross-sectional area by muscle. Left panel refers to female and right to male. Median (solid line in the middle) and percentiles corresponding to +/-1 SD (dashed lines) and +/- 2 SD (outer solid lines) were presented. Please note, that X-axis ranges are not the same for female and male.
Table 3.
Skewness (L), median (M) and coefficient of variation (S) equations of reference data in girls by age.
| L | M | S | |
|---|---|---|---|
| Bone mineral densities: | |||
| tibia 4% trabecular bone density | 0,8264 | 157,404+3,4028*age | 0,1272 |
| tibia 4% total bone density | 0,3732 | 88,0362+98,1297*age-20,0600*age2+1,8733*age3-7,9653*10-2*age4+1,26745*10-3*age5 | 7,56155*10-2+2,01689*age*10-3 |
| tibia 14% cortical bone density | 7,6197 | 937,047+17,1715*age-3,7023*age2+0,3622*age3-9,657*10-3*age4 | 3,2043*10-2-3,2849*10-3*age+7,4033*10-4*age2-5,4627*10-5*age3+1,23242*10-6*age4 |
| tibia 38% cortical bone density | 4,9026 | 719,551+163,609*age-29,7500*age2+2,51702*age3-9,5202*10-2*age4+1,30813*10-3*age5 | 2,94155*10-2-3,7149*10-3*age+7,0695*10-4*age2-4,9731*10-5*age3+1,0976*10-6*age4 |
| Bone masses: | |||
| tibia 4% bone mass | 0,7298 | 0,3329+7,29773*10-2*age+1,2722*10-2*age2-4,7228*10-4*age3 | 6,1284*10-2+6,2543*10-4*age+2,4449*10-3*age2-2,2574*10-4*age3+5,4631*10-6*age4 |
| tibia 14% bone mass | 1,3244 | 1,85144-0,5265*age+8,62943*10-2*age2-4,4714*10-3*age3+7,66275*10-5*age4 | 0,10831-1,3379*10-2*age+3,1976*10-3*age2-2,3579*10-4*age3+5,20791*10-6*age4 |
| tibia 38% bone mass | 0,9428 | 2,4402-0,71987*age+0,126419*age2-7,0882*10-3*age3+1,34261*10-4*age4 | 0,1480-5,7196*10-2*age+1,4004*10-2*age2-1,3429*10-3*age3+5,6433*10-5*age4-8,7506*10-7*age5 |
| Cross-sectional bone dimensions: | |||
| tibia 14% inner cortical bone circumference | -1,0275 | 23,8715+3,78121*age-0,10329*age2 | -4,6188*10-2+1,63574*10-2*age+1,8331*10-4*age2-7,9313*10-5*age3+2,3879*10-6*age4 |
| tibia 38% inner cortical bone circumference | 2,6179-7,8301*10-2*age | 19,6632+2,06156*age-5,8119*10-2*age2 | -2,7826*10-2+2,0926*10-2*age-1,1272*10-3*age2+1,8303*10-5*age3 |
| tibia 14% outer cortical bone circumference | 0,9736 | 44,1865-2,2403*age+0,8945*age2- 5,899*10-2*age3+1,17676*10-3*age4 | -5,0128*10-2+1,55749*10-2*age+8,79176*10-5*age2-7,5197*10-5*age3+2,26256*10-6*age4 |
| tibia 38% outer cortical bone circumference | 2,03708 | 44,6343-3,3879*age+0,9888*age2-6,3447*10-2*age3+1,27336*10-3*age4 | 4,4675*10-2-2,3796*10-2*age+6,6556*10-3*age2-6,3441*10-4*age3+2,5717*10-5*age4-3,8294*10-7*age5 |
| tibia 14% cortical shell thickness | 0,5137 | 1,94036-0,31987*age+5,45486*10-2*age2-2,8687*10-3*age3+5,08128*10-5*age4 | 0,1067 |
| tibia 38% cortical shell thickness | 1,0253 | 3,39175-0,62185*age+0,132679*age2 -8,2879*10-3*age3+1,71382*10-4*age4 | 0,1469-4,2984*10-2*age+1,0330*10-2*age2-1,0769*10-3*age3+4,9750*10-5*age4-8,4016*10-7*age5 |
| tibia 14% cortical bone cross-sectional area | -0,0910 | 44,6006-2,4488*age+1,33172*age2-4,6375*10-2*age3 | 0,11557-1,4773*10-3*age |
| tibia 38% cortical bone cross-sectional area | 0,1490 | 210,478-65,519*age+11,7564*age2-0,68466*age3+1,3369*10-2*age4 | 0,1804-7,5984*10-2*age+1,8370*10-2*age2-1,7777*10-3*age3+7,5837*10-5*age4-1,1954* 10-6*age5 |
| tibia 4% total bone cross-sectional area | -3,4707*10-2 | -113,13+102,799*age-2,1736*age2-1,281*10-2*age3 | 1,06619*10-2+1,5513*10-2*age-4,1191*10-4*age2 |
| tibia 14% total bone cross-sectional area | 0,5152 | 203,005-41,084*age+10,5224*age2-0,6410*age3+1,23186*10-2*age4 | -9,8074*10-2+3,06558*10-2*age+2,16471*10-4*age2-1,5167*10-4*age3+4,54268*10-6*age4 |
| tibia 38% total bone cross-sectional area | 1,0299 | 204,76-46,118*age+10,3535*age2-0,62309*age3+1,2098*10-2*age4 | 9,2009*10-2 -4,7808*10-2*age+1,3265*10-2*age2-1,2613*10-3*age3+5,10596*10-5*age4-7,59398*10-7*age5 |
| Longitudinal shape indexes: | |||
| tibia 4% bone mass/tibia 38% bone mass | -0,6073 | 0,79333+2,38356*10-2*age-3,6586*10-3*age2+2,54507*10-4*age3-5,5627* 10-6*age4 | 6,68917*10-2+1,27681*10-3*age |
| tibia 14 cortical bone cross-sectional area/tibia 4% total bone cross-sectional area | 0,6857 | 12,0647+2,15948*age-,46201*age2+4,48215*10-2*age3-1,9576*10-3*age4+3,18458*10-5*age5 | 9,8563*10-2+3,93025*age*10-3 |
| Strength strain indexes: | |||
| tibia 14% polar SSI | 0,7565 | 1458,4-546,73*age+84,8981*age2-4,4804*age3+7,93078*10-2*age4 | 0,1438 |
| tibia 38% polar SSI | 0,6480 | 1066,35-382,68*age+65,063*age2-3,5543*age3+6,52281*10-2*age4 | 0,1424-5,2296*10-2*age+1,4716*10-2*age2-1,4214*10-3*age3+5,8444*10-5*age4-8,8297*10-7*age5 |
| Muscle and bone: | |||
| lower leg 66% muscle cross-sectional area | 1,1138 | 1241,1+119,067*age+26,4935*age2-0,95898*age3 | 9,67039*10-2-1,4375*10-2*age+4,02748*10-3*age2-2,8429*10-4*age3+5,90889*10-6*age4 |
| lower leg 66% total cortical bone cross-sectional area/muscle cross-sectional area | 0,1264 | 4,7680+0,2843*age-0,1895*age2+4,5368*10-2*age3-4,5102*10-3*age4+1,9971*10-4*age5-3,2810*10-6*age6 | 8,86228*10-2+1,21777*age*10-3 |
SSI - strength strain index.
Table 4.
Skewness (L), median (M) and coefficient of variation (S) equations of reference data in boys by age.
| L | M | S | |
|---|---|---|---|
| Bone mineral densities: | |||
| tibia 4% trabecular bone density | -0,2832 | 171,179+3,3626*age-0,1698*age2+1,0817*10-2*age3 | 0,1133 |
| tibia 4% total bone density | 0,6297 | 401,00-67,1839*age+15,4126*age2-1,6240*age3+7,8935*10-2*age4-1,4092*10-3*age5 | 7,2354*10-2+1,5511*10-3*age |
| tibia 14% cortical bone density | 0,4514 | 742,886+76,5780*age-9,5335*age2+0,5446*age3-1,0542*10-2*age4 | 1,9533*10-2+7,6087*10-3*age-1,8746*10-3*age2+2,0361*10-4*age3-9,9692*10-6*age4+1,7733*10-7*age5 |
| tibia 38% cortical bone density | 2,0731 | 940,843+46,1996*age-7,7822*age2+0,54045*age3-1,2085*10-2*age4 | 3,9939*10-2-9,8029*10-4*age |
| Bone masses: | |||
| tibia 4% bone mass | -2,8187+0,1938*age | 0,4058+0,1147*age+4,12556*10-3*age2 | 1,3898*10-2+2,0079*10-2*age-1,0039*10-3*age2+1,3619*10-5 *age3 |
| tibia 14% bone mass | -0,6217 | 0,2335+0,1178*age+1,6194*10-3*age2 | 3,2464*10-2+9,30895*10-3*age+4,71243*10-4*age2-7,4468*10-5* age3+1,7765*10-6*age4 |
| tibia 38% bone mass | 0,1006 | 1,1071-9,1079*10-2*age+2,6378*10-2*age2-6,9141*10-4*age3 | -1,2872*10-2+7,4554*10-3*age+3,2708*10-3*age2-4,3723*10-4*age3+2,0380*10-5*age4-3,5525*10-7*age5 |
| Cross-sectional bone dimensions: | |||
| tibia 14% inner cortical bone circumference | -0,6637 | 39,2621-1,4721*age+0,36296*age2-1,1853*10-2*age3 | 8,8731*10-2-6,6608*10-3*age+1,5447*10-3*age2-9,8381*10-5 *age3+2,0001*10-6*age4 |
| tibia 38% inner cortical bone circumference | -0,1343 | 23,8561+1,3192*10-2*age+0,1594*age2-5,8725*10-3*age3 | 9,3094*10-2 |
| tibia 14% outer cortical bone circumference | -0,5518 | 46,2352-1,0548*age+0,4012*age2-1,3327*10-2*age3 | 5,9099*10-2-8,1400*10-3*age+1,7762*10-3*age2-1,1328*10-4*age 3+2,2484*10-6*age4 |
| tibia 38% outer cortical bone circumference | -1,4323*10-2 | 41,2633-0,6504*age+0,3708*age2-1,2564*10-2*age3 | 3,3437*10-2-4,6227*10-3*age+1,62194*10-3*age2-1,1375*10-4 *age3+2,2377*10-6*age4 |
| tibia 14% cortical shell thickness | 0,2622 | 3,3317-1,3562*age+0,3274*age2-3,3002*10-2*age3+1,5273*10-3*age4-2,6389*10-5*age5 | 0,1176+1,7971*10-2*age-3,2675*10-3*age2+1,9034*10-4*age3-3,5583*10-6*age4 |
| tibia 38% cortical shell thickness | -2,5409+0,1969*age | 1,8116+0,2145*age | 0,1781-7,0302*10-2*age+1,9224*10-2*age2-2,4244*10-3*age3+1,5819*10-4*age4-5,1892*10-6*age5+6,7672*10-8*age6 |
| tibia 14% cortical bone cross-sectional area | -0,8467 | 8,0281+11,4348*age-3,0568*10-2*age2 | 0,1233 |
| tibia 38% cortical bone cross-sectional area | 0,2262 | 88,3776-6,2951*age+2,2729*age2-6,578*10-2*age3 | 2,316*10-2+1,0033*10-2*age+7,8367*10-4*age2-1,0241*10-4* age3+2,4068*10-6*age4 |
| tibia 4% total bone cross-sectional area | -0,7159 | 436,881-64,494*age+12,523*age2-0,3809*age3 | 7,9140*10-2+3,4917*10-3*age |
| tibia 14% total bone cross-sectional area | -0,2495 | 205,55-22,644*age+4,7713*age2-0,14451*age3 | 0,1175-1,6459*10-2*age+3,6482*10-3*age2-2,3757*10-4*age3+4,8245*10-6*age4 |
| tibia 38% total bone cross-sectional area | -2,5012+0,2004*age | 187,744-25,369*age+4,9541*age2-0,14929*age3 | 6,2502*10-2-9,1433*10-3*age+3,3309*10-3*age2-2,3344*10-4 *age3+4,5522*10-6*age4 |
| Longitudinal shape indexes: | |||
| tibia 4% bone mass/tibia 38% bone mass | -0,4601 | 0,9959-5,2323*10-2*age+1,2045*10-2*age2-1,2433*10-3*age3+5,8072*10-5*age4-9,8856*10-7*age5 | 7,5388*10-2 |
| tibia 14 cortical bone cross-sectional area/tibia 4% total bone cross-sectional area | 1,1462 | 23,0647-3,1826*age+0,8235*age2-0,1051*age3+0,6884*10-2*age4-0,2215*10-3*age5+2,7788*10-6*age6 | 0,1382+1,1325*10-3*age |
| Strength strain indexes: | |||
| tibia 14% polar SSI | -7,6120*10-2 | 390,785-82,752*age+16,4635*age2-0,43379*age3 | -0,2955+0,3064*age-8,5276*10-2 *age2+1,1714*10-2*age3-8,3430*10-4 *age4+2,9589*10-5*age5-4,1378*10-7*age6 |
| tibia 38% polar SSI | -1,7668+0,1150*age | 534,607-124,85*age+21,1815*age2-0,5712*age3 | 8,7851*10-2-2,725*10-3*age+2,7320*10-3*age2-2,2710*10-4*age3+5,0576*10-6*age4 |
| Muscle and bone: | |||
| lower leg 66% muscle cross-sectional area | -0,1394 | 3056,75-407,25*age+69,4287*age2-1,8023*age3 | 9,4837*10-2+1,0840*10-2*age-2,6429*10-3 *age2+3,3988*10-4*age3-1,8862*10-5*age4+3,5905*10-7*age5 |
| lower leg 66% total cortical bone cross-sectional area/muscle cross-sectional area | -0,7536 | 4,2915+0,13873*age+1,12451*10-2*age2-1,6858*10-3*age3+4,4937*10-5*age4 | 0,1283-1,5868*10-3*age |
SSI - strength strain index.
Table 5.
Skewness (L), median (M) and coefficient of variation (S) equations of lower leg total bone cross-sectional area reference data by muscle cross-sectional area in girls and boys.
| L | M | S | |
|---|---|---|---|
| Girls | |||
| lower leg 66% total bone cross-sectional area | -0,6716 | 360,8140-0,33088*muscle area+1,3858*10-4*muscle area2-1,9981*10-8*muscle area3+9,8096*10-13*muscle area4 | 9,8594*10-2 |
| Boys | |||
| lower leg 66% total bone cross-sectional area | 1,5941*10-2 | -36,1830+7,3339*10-2*muscle area-2,0790*10-6*muscle area2 | 0,1512-8,5737*10-6*muscle area |
Table 6.
Skewness (L), median (M) and coefficient of variation (S) equations of reference data in girls by height.
| L | M | S | |
|---|---|---|---|
| Bone mineral densities: | |||
| tibia 4% trabecular bone density | 0,8008 | 88,7287+0,735593*height | 0,1293 |
| tibia 4% total bone density | 0,2044 | -6078,6+190,03*height-2,1054*height2+1,02027*10-2*height3 -1,8196*10-5*height4 | 149,4879-6,61461617*height+ 0,12119936*height2-1,176517*10-3 *height3+6,3816565*10-6*height4 -1,833856*10-8*height5+ 2,1810967*10-11*height6 |
| tibia 14% cortical bone density | 3,7614 | -14140+457,707*height -5,1248*height2+2,50793*10-2*height3 -4,5078*10-5*height 4 | -2,0819*10-2+3,96338*10-4*height |
| tibia 38% cortical bone density | 4,7061 | -8541,9+292,895*height -3,2997*height2+1,62225*10-2*height3 -2,9235*10-5*height4 | -5,5760447+0,2039556*height-2,9492889*10-3*height2+2,11052*10-5*height3-7,457398*10-8*height4+1,03945937*10-10*height5 |
| Bone masses: | |||
| tibia 4% bone mass | 5,78833-3,9634*10-2*height | 1,90092-1,8843*10-2*height+8,8671* 10-7*height3 | 0,1162 |
| tibia 14% bone mass | 1,2970 | -50,146+1,62406*height-1,9249*10-2 *height2+9,99644*10-5 *height3-1,897*10 -7*height4 | 8,8153*10-2 |
| tibia 38% bone mass | 1,8123 | 27,4799-0,58537*height+4,15938*10-3*height2-9,1412*10-6*height3 | 3,13279*10-2+3,75259*10-4*height |
| Cross-sectional bone dimensions: | |||
| tibia 14% inner cortical bone circumference | -2,0249 | -14,38+0,5949*height-9,5597 *10-4*height2 | -11,202+0,4323*height-6,5365*10-3*height2+4,8577*10-5*height3-1,7734*10-7*height4+2,547*10-10*height5 |
| tibia 38% inner cortical bone circumference | 1,2946 | 584,472-15,694*height+0,1618*height2-7,2212*10-4*height3+1,1910*10-6*height4 | 0,8097-3,311*10-2*height+4,50197* 10-4*height2-2,4548* 10-6*height3+4,7361*10-9*height4 |
| tibia 14% outer cortical bone circumference | -1,8520 | 397,801-8,2336*height+6,2229*10-2*height2-1,4698*10-4*height3 | 4,67529*10-3+3,0756*10-4*height |
| tibia 38% outer cortical bone circumference | 2,8056 | 353,243-7,307*height+5,5441*10-2*height2-1,3121*10-4*height3 | 2,04158-6,239*10-2*height+ 7,0782*10-4*height2-3,4915*10-6 *height3+6,3588*10-9*height4 |
| tibia 14% cortical shell thickness | 0,7147 | 14,2147-0,28795*height+2,05653*10-3*height2-4,5314*10-6*height3 | 551,30068-23,842202*height+ 0,42727205*height2-4,06019945* 10-3*height3+2,15755569*10-5*height4-6,07850668*10-8*height5+ 7,09298513*10-11*height6 |
| tibia 38% cortical shell thickness | 1,0490 | 25,0294-0,52953*height+3,9816*10-3*height2-9,2041*10-6*height3 | 7,9529*10-2 |
| tibia 14% cortical bone cross-sectional area | -0,41225 | 994,614-21,17*height+0,151302*height2-3,2654*10-4*height3 | 0,1004 |
| tibia 38% cortical bone cross-sectional area | 1,2621 | 2407,38-52,67*height+0,385324* height2-8,8154*10-4*height3 | -123,51397+5,5815059*height-0,10439186*height2+1,0340742* 10-3*height3-5,717897*10-6* height4+1,6726876*10-8*height5- 2,0219798*10-11*height6 |
| tibia 4% total bone cross-sectional area | -1,5938 | -38,463-0,9026*height+4,0533 *10-2*height2 | 1,6331*10-2+6,2032*10-4*height |
| tibia 14% total bone cross-sectional area | -0,9468 | 3915,37-85,552*height+0,6306*height2-1,4566*10-3*height3 | 2,31054-6,7461*10-2*height+ 7,3997*10-4*height2-3,505*10-6* height3+6,1093*10-9*height4 |
| tibia 38% total bone cross-sectional area | 1,3630 | 3594,13-78,785*height+0,581793* height2-1,3516*10-3*height3 | -1,2402*10-2+6,5998*10-4*height |
| Longitudinal shape indexes: | |||
| tibia 4% bone mass/tibia 38% bone mass | -0,3934 | -411,262+18,746*height-0,35322453*height2+3,5276424*10-3*height3-1,968711*10-5*height4+5,8194501*10-8*height5-7,116013*10-11*height6 | 7,9559*10-2 |
| tibia 14 cortical bone cross-sectional area/tibia 4% total bone cross-sectional area | 3,57313-1,9773*10-2*height | 4024,6838-179,785227*height+ 3,3401043*height2-3,28779034*10-2 *height3+1,8073438*10-4*height4- 5,25844*10-7*height5+6,324917 *10-10*height6 | 292,70273-12,927645*height+ 0,23651817*height2-2,29294448* 10-3*height3+1,24205662*10-5* height4-3,56377566*10-8*height5+ 4,23112132*10-11*height6 |
| Strength strain indexes: | |||
| tibia 14% polar SSI | 1,6067 | 13976,5-297,96*height+2,0696*height2-4,4207*10-3*height3 | 0,1137 |
| tibia 38% polar SSI | 0,7615 | 12756,5-273,62*height+1,9209*height2-4,1356*10-3*height3 | 3,9480*10-2+5,8458*10-4*height |
| Muscle and bone: | |||
| lower leg 66% muscle cross-sectional area | 1,41545 | -203199+6199,95*height-69,814*height2+0,34635*height3-6,3268*10-4*height4 | -18,61409+0,699731*height-1,0389806*10-2*height2+7,642861*10-5*height3-2,781624*10-7*height4+4,00591 |
| *10-10*height5 | |||
| lower leg 66% total cortical bone cross-sectional area/muscle cross-sectional area | -3,8607*10-2 | 178,232-5,0993*height+5,53166*10-2*height2-2,6227*10-4*height3+4,5979 *10-7*height4 | -29,945389+1,128302*height-1,6756913*10-2*height2+1,228881*10-4*height3-4,44685*10-7*height4+ 6,34976*10-10*height5 |
SSI - strength strain index.
Table 7.
Skewness (L), median (M) and coefficient of variation (S) equations of reference data in boys by height.
| L | M | S | |
|---|---|---|---|
| Bone mineral densities: | |||
| tibia 4% trabecular bone density | -0,5997 | 200,183-0,61762*height+4,32092*10-3*height2 | 7,15718*10-2+3,21482*10-4*height |
| tibia 4% total bone density | 0,1987 | -20576,9264+970,939843*height-18,6484612*height2+0,189068134*height3-1,0662092*10-3*height4+3,168456*10-6*height5-3,873361*10-9*height6 | 3,1055*10-2+4,34676*10-4*height |
| tibia 14% cortical bone density | 2,9340 | 34346,82-1234,5212*height+17,94951*height2-0,12843*height3+4,52647*10-4*height4-6,2860 *10-7*height5 | 3,1634*10-2 |
| tibia 38% cortical bone density | 4,9672 | 75779,9894-3265,39257*height+58,535159*height2-0,55135735*height3+2,87931*10-3*height4-7,90795*10-6*height5+8,93121*10-9*height6 | -2,9987616+0,1079134*height-1,5140745*10-3*height2+1,047007*10-5*height3-3,5706*10-8*height4+4,803898*10-11*height5 |
| Bone masses: | |||
| tibia 4% bone mass | -0,1220 | 1,97259-3,39998*10-2*height+2,3726*10-4*height2 | 1,3117-4,8453*10-2*height+6,15527*10-4*height2-3,1517*10-6*height3+5,70261*10-9*height4 |
| tibia 14% bone mass | 1,1580 | 0,73912-1,4807*10-2*height+1,4514*10-4*height2 | 0,277237-1,4437*10-2*height+2,18965*10-4*height2-1,1988*10-6*height3+2,22643*10-9*height4 |
| tibia 38% bone mass | 1,78866 | 1,56796-2,8963*10-2*height+2,32385*10-4*height2 | 0,916189-3,563*10-2*height+4,58618*10-4*height2-2,3362*10-6*height3+4,15619*10-9*height4 |
| Cross-sectional bone dimensions: | |||
| tibia 14% inner cortical bone circumference | 6,1170*10-2 | 10,7713+0,216343*height+3,67005*10-4*height2 | 0,630537-2,0979*10-2*height+2,5633*10-4*height2-1,2566*10-6*height3+2,16801*10-9*height4 |
| tibia 38% inner cortical bone circumference | 0,6431 | 93,5557-1,7584*height+1,41779*10-2*height2-3,3488 *10-5*height3 | 8,9690*10-2 |
| tibia 14% outer cortical bone circumference | 1,8465 | 99,8532-1,6635*height+1,45412*10-2*height2-3,2982 *10-5*height3 | 0,821803-2,6315*10-2*height+3,03449*10-4*height2-1,4392*10-6*height3+2,41695 *10-9*height4 |
| tibia 38% outer cortical bone circumference | 3,2876 | 93,6545-1,6355*height+1,452*10-2*height2-3,31796 *10-5*height3 | 0,514444-1,6771*10-2*height+1,94698 *10-4*height2-9,1193*10-7*height3+1,4874 *10-9*height4 |
| tibia 14% cortical shell thickness | 0,8238 | 262,927425-9,2478634*height+0,1285329*height2-8,787944*10-4*height3+2,961946*10-6*height4-3,93825*10-9*height5 | 8,07385-0,27364*height+3,49572*10-3*height2-1,8837*10-5*height3+2,1353*10-8*height4+1,5950*10-10*height5-4,3051*10-13*height6 |
| tibia 38% cortical shell thickness | 8,0732*10-2 | 0,14501+1,72803*10-2*height+6,71656*10-5*height2 | 9,66555*10-2 |
| tibia 14% cortical bone cross-sectional area | 0,2483 | -4,3523-0,13727*height+6,97975*10-3*height2 | 8,511526-0,317056839*height+4,652523*10-3*height2-3,334365*10-5*height3+1,171552*10-7*height4-1,61839599*10-10*height5 |
| tibia 38% cortical bone cross-sectional area | 0,8404 | 34,6094-0,92780*height+1,40242*10-2*height2 | 1,31673-4,3702*10-2*height+5,17865*10-4*height2-2,5036*10-6*height3+4,26367 *10-9*height4 |
| tibia 4% total bone cross-sectional area | -0,58337 | -129,47+0,763578*height+3,35744*10-2*height2 | 1,43979-4,0392*10-2*height+4,34936*10-4*height2-1,9966*10-6*height3+3,34038 *10-9*height4 |
| tibia 14% total bone cross-sectional area | 0,9850 | 1312,2-28,087*height+0,212575*height2-4,5363 *10-4*height3 | 1,24425-4,2546*10-2*height+5,12052*10-4*height2-2,4868*10-6*height3+4,23687 *10-9*height4 |
| tibia 38% total bone cross-sectional area | 1,9341 | 1324,82-28,855*height+0,217878*height2-4,6817 *10-4*height3 | -0,24955+2,77248*10-3*height+7,80171 *10-6*height2-6,9121*10-8*height3 |
| Longitudinal shape indexes: | |||
| tibia 4% bone mass/tibia 38% bone mass | -0,5120 | 0,910835+4,84818*10-5*height | 6,59501*10-2+7,29081*10-5*height |
| tibia 14 cortical bone cross-sectional area/tibia 4% total bone cross-sectional area | 1,0671 | 18,071 | 0,123671+1,9679*10-4*height |
| Strength strain indexes: | |||
| tibia 14% polar SSI | 1,2607 | 641,883-16,349*height+0,121737*height2 | 1,95495-5,8667*10-2*height+6,5576*10-4*height2-3,0613*10-6*height3+5,09586 *10-9*height4 |
| tibia 38% polar SSI | 1,50984 | 549,831-15,454*height+0,123465*height2 | 0,924153-3,2983*10-2*height+4,15979 *10-4*height2-2,0763*10-6*height3+3,59062*10-9*height4 |
| Muscle and bone: | |||
| lower leg 66% muscle cross-sectional area | 0,1487 | 3287,27-55,792*height+0,434791*height2 | 1,38028-4,0067*10-2*height+4,42975 *10-4*height2-2,0613*10-6*height3+3,45751*10-9*height4 |
| lower leg 66% total cortical bone cross-sectional area/muscle cross-sectional area | -0,6742 | 11,8540+8,9291*10-2*height-6,6293*10-3 *height2+8,7163*10-5*height3-4,46365 *10-7*height4+8,0707*10-0*height5 | 0,1114 |
SSI - strength strain index.
Discussion
Untilnow, thereareonly2studiesconcerninganthropometric determinants of pQCT outcomes. Moyer-Mileur et al.[14] studied lower leg while Neu et al.[23] forearm. Moyer-Mileur et al.[14] found body mass index as main determinant of trabecular bone density, age for cortical density and cortical shell thickness, weight for lower leg muscle cross-sectional area and height for bone mass, cortical bone cross-sectional area, total bone cross-sectional area and strength strain index. Neu et al.[23] found body mass index as main determinant of trabecular bone mineral density at the radius, age for total bone mineral density and cortical bone mineral density (at the 4% of the radius length) while height was the main determinant of total bone cross-sectional area at the same site. In our population weight emerged as the main determinant of more than half of studied pQCT outcomes, including bone masses, strength strain index, cross-sectional bone dimensions (with exception of inner cortical bone circumference at 38% of the tibia length and cortical shell thickness at 14% of the tibia length) and for muscle cross-sectional area. Age was the main determinant of one-fifth our pQCT outcomes, primarily total and cortical bone mineral density as well as total bone cross-sectional area (4% of the tibia length) and cortical shell thickness (14% of the tibia length). Height appeared as the main determinant of inner cortical bone circumference (38% of the tibia length) and lower leg 66% total cortical bone cross-sectional area to muscle cross-sectional area ratio. Our data are in accordance to Moyer-Mileur et al.[14] and Neu et al.[23] as to the main determinants of: tibia 4% trabecular bone density – body mass index; tibia 4% total bone density, tibia 14% cortical bone density and tibia 38% cortical bone density – age; and lower leg 66% muscle cross-sectional area – the main determinant is weight. However, in the case of 38% bone mass, 38% cortical bone cross-sectional area, tibia 38% total bone cross-sectional area, tibia 38% polar SSI, tibia 38% cortical shell thickness and 4% total bone cross-sectional area we found other determinants than previously published. For the first four Moyer-Mileur et al.[14] found height as the main independent determinant while we found weight, for the second to last the same Authors found age while we found weight and for the last one Neu et al.[23] found height while in our study age appeared as the main and independent factor. For other pQCT outcomes such as bone masses, cross-sectional dimensions and strength we found, in general, weight as the main independent factor. It would be helpful to compare our results with other studies, however, until then, published data do not comprise full set of pQCT outcomes, in particular: bone masses, dimensions and strengths in the respective slices. Notwithstanding of this, we hypothesize that due to the absence of overweight and obese children in our sample, weight is much more interrelated with height than in the case of presence overweight and obese ones. So, weight became the main determinant of the bone strength instead of height, especially that, weight emerged as the main and very strong determinant of the muscle area in our sample, which is, in turn, the main source of loads for bones[24].
Considerable methodological differences between the published studies presenting normative data for lower leg exist. Binkley et al.[13] utilized 20% of the tibia length site, while Moyer-Mileur et al.[14] used 4% and 66% sites. On the contrary, Roggen et al.[12] utilized 4%, 14% and 38% tibial length sites. In the present study we use 4%, 14%, 38% and 66% tibial length sites, which allow us to provide reference data for the full set of bone and muscle outcomes. The second of the most important methodological differences concerns scout view and the reference line placement. Binkley et al.[13] did not apply the scout view, they manually set the measurement site. Roggen et al.[12] and Moyer-Mileur et al.[14] used scout view. The first ones placed the reference line at the proximal border of the most distal growth plate in the case growth plate was open or at the distal endplate if the growth plate was fused, while the second ones placed the reference line at the most proximal line of the growth plate or the endplate, respectively. The Moyer-Mileur et al.[14] formula of placing the reference line results in losing from analysis 28% of 4% site measurements due to the growth plate interference (i.e. trabecular bone mineral density >290 mg/cm3). Roggen et al.[12] did not report such a loss of the cases, however, they did not make assumption about the upper border of trabecular bone mineral density. In the present study, the reference line was placed in the middle of the growth plate, or, if it is fused, in the middle of the endplate. We did not observe interference of the growth plate with 4% site of measurement. The 4% site line is displayed on scout view screen automatically by the software, during the reference line placement process, so the interference could be easily detected by the operator. Moreover, the upper border of presented reference data (i.e. +2 SD) do not excess 280 mg/cm3 in girls and 320 mg/cm3 in boys.
Technical parameters of the measurements and analysis are different across the published studies, too.
The discrepancies described above make comparison of our results with published reference datasets difficult, although a few comparisons can be done. Trabecular volumetric bone mineral density (4% of the tibia length) seems to be consistent across studied population[12,14,25]. The differences concern younger children. In younger girls median of our data was lower by 25 mg/cm3 (14%) and 70 mg/cm3 (41%) in the comparisons to Belgian and Salt Lake City data, respectively; in younger boys medians were lowered by 15 mg/cm3 (9%) and 55 mg/cm3 (30%), respectively, while in the older boys and girls values were nearly the same, despite of the fact that Salt Lake City data was organized by height, not by age. Cortical bone mineral density was even more stable across studied populations than trabecular bone mineral density, for both 14% and 38% of the length of the tibia. For 14% of tibial length site the maximum difference in median was 40 mg/cm3 (4%) in younger boys in comparison with South Dakota data[13] in the favour of South Dakota population. For other age and sex groups the values were similar, even that Binkley TL et al.[13] utilized 20% of the tibia length site, as it must be stressed. For 38% of the tibia length site our girls show higher median of cortical bone mineral density than Belgian[12,25] ones: 45 mg/cm3 (4%) and 95 mg/cm3 (8%) for younger and older girls, respectively, while values for boys were nearly the same. Inner cortical circumference, outer cortical bone circumference as well as cortical cross-sectional area at 14% of the tibia length were similar in Belgian[12,25], South Dakota[13] and our boys and girls, the maximal difference in medians do not exceed 7 mm (18%) for circumferences and 23 mm2 (11%) for cross-sectional cortical area, despite of the fact that measurement in South Dakota population were done at 20% of the tibial length. In the case of 38% tibial length the differences were slightly more pronounced. For inner cortical bone circumference Belgian[12,25] younger boys and girls showed 8 mm (28% and 30%, respectively) higher medians than our ones. For outer cortical bone circumference at this site our younger girls showed smaller median than Belgian (8 mm, 18%). For other age groups the differences were smaller. Cortical shell thickness at the same measurement site was consistent across Belgian and our populations. The highest difference was noted in younger boys, 0,6 mm (21%) in the favour of our population. For total bone cross-sectional areas the difference were pronounced for both: younger boys and younger girls. Medians of the total bone cross-sectional area at 4% of tibial length site was higher in Belgian group than in our by 70 mm2 (19%) and 60 mm2 (17%), respectively, for 14% site by 60 mm2 (30%) and 35 mm2 (20%), respectively, for 38% site by 40 mm2 (25%) and 60 mm2 (36%) in boys and in girls, respectively, while for older children the differences were smaller. These dissimilarities may be attributed to differences in studied population as well as to methodological differences.
The voluntary basis of the participation might have introduced selection bias, since the Warsaw area, from where our study group originated, is known to have a slightly higher prevalence rate of overweight and obesity than the rest of Poland[26,27]. To avoid the selection bias we excluded overweight and obese children[15,16] as well as these with disease that may affect bone metabolism and with more than 2 past fractures. Another issue is partial volume effect, which may lead to a underestimation of cortical volumetric bone mineral density in the youngest children[8]. This phenomenon could be at least partially removed by using an algorithm developed to eliminate the partial volume effect, however, this algorithm has not been yet validated in children[28], so no correction was made. Another limitation is lack of Tanner stage assessment. While pubertal stage is one of the main determinants of bone development[14,23,29] it would be useful to incorporate Tanner stage into analysis. Unfortunately, pubertal stage assessment, even in the form of the self-assessment, was considered as intrusive by adolescents and their parents. In the consequence and due to the ethics committee position, we were not able to collect pubertal data in the studied population. Another limitation is relatively low number of participants. Published studies, presenting reference data for extremities by pQCT method, utilize from 83 participants[30] to 665 participants[31]. Our sample size (n=222) fit in the range reported in literature, although near their lower limit. The last limitation of the study is related to its cross-sectional design. Cross-sectional data could not necessarily reflect longitudinal changes in the individual growth and development. Finally, it must be stressed, that application of presented reference data may be limited if measurements have been done at different slices of the tibia or with different measurement or analysis parameters.
In summary, in this study we present reference data for bone densities, cross-sectional sizes and strength as well as for regional muscle distribution and bone cross-sectional area by muscle area measured by the pQCT at the 4%, 14%, 38% and 66% site of the tibia length in children and adolescent in a way allowing simple and reliable calculation of Z scores. In consequence, the early detection of the bone and regional muscle distribution abnormalities may be now implemented in everyday clinical practice.
Acknowledgements
This study is supported by specific-user subvention from Ministry of Science and Higher Education to Children’s Memorial Health Institute for research activity; Children’s Memorial Health Institute’s statutory research task No: 220/12.
Acquiring of Stratec XCT 2000L was cofinanced by ERDF (EU Structural Funds) project POIG.02.01.00-14-059/09.
MJ, MK and KG are responsible for subject enrolment; MJ, MK and KG drafted the manuscript and completed manuscript revision; MJ is responsible for study design, outcome assessment, data collection, statistical analysis, data interpretation, literature search and funds collection; MJ takes responsibility for the integrity of the data analysis.
Appendix
Example of Z-score calculation
A boy, aged 9,97 yrs, underwent pQCT measurement of the bone mass at the 38% of the tibia length. The results was 1,61 g. As shown in Table 4, M and S can be calculated as:
M=1,1071-9,1079*10-2*9,97+2,6378*10-2*9,972-6,9141*10-4*9,973=2,1358
S=-1,2872*10-2+7,4554*10-3*9,97+3,2708*10-3*9,972-4,3723*10-4*9,973+2,0380*10-5*9,974-3,5525*10-7 *9,975=0,1196,
while L is constant and equals 0,1006.
According to Cole TJ [19] Z-score can be calculated with formula:
Z-score=[(result/M)L-1]/(L*S).
Putting data into the formula we get:
Z-score=[(1,61/2,1358)0,1006-1]/(0,1006*0,1196)=-2,33.
After incorporate equations into spreadsheet program, calculations can be done automatically.
It must be concluded, that him bone mass at the tibia 38% measurement site is lower than expected for age and sex.
Footnotes
Children’s Memorial Health Institute received specific-user subvention from Ministry of Science and Higher Education for research activity; Children’s Memorial Health Institute’s statutory research task No: 220/12. Ac-quiring of Stratec XCT 2000L apparatus was co financed by ERDF, project POIG.02.01.00-14-059/09.
Edited by: G. Lyritis
References
- 1.Binkley TL, Berry R, Specker BL. Methods for measurement of pediatric bone. Rev Endocr Metab Disord. 2008;9:95–106. doi: 10.1007/s11154-008-9073-5. [DOI] [PubMed] [Google Scholar]
- 2.Zemel BS. Quantitative computed tomography and computed tomography in children. Curr Osteoporos Rep. 2011;9:284–90. doi: 10.1007/s11914-011-0076-x. [DOI] [PubMed] [Google Scholar]
- 3.Stagi S, Cavalli L, Iurato C, Seminara S, Brandi ML, de Martino M. Bone health in children and adolescents:the available imaging techniques. Clin Cases Miner Bone Metab. 2013;10:166–71. [PMC free article] [PubMed] [Google Scholar]
- 4.Schoenau E, Neu CM, Beck B, Manz F, Rauch F. Bone mineral content per muscle cross-sectional area as an index of the functional muscle-bone unit. J Bone Miner Res. 2002;17:1095–101. doi: 10.1359/jbmr.2002.17.6.1095. [DOI] [PubMed] [Google Scholar]
- 5.Schoenau E, Neu MC, Manz F. Muscle mass during childhood - relationship to skeletal development. J Musculoskelet Neuronal Interact. 2004;4:105–8. [PubMed] [Google Scholar]
- 6.Stratec XCT 2000L manual. Stratec Medizintechnik. 2011 [Google Scholar]
- 7.Fonseca A, Gordon CL, Barr RD. Peripheral quantitative computed tomography (pQCT) to assess bone health in children, adolescents, and young adults:a review of normative data. J Pediatr Hematol Oncol. 2013;35:581–9. doi: 10.1097/MPH.0000000000000017. [DOI] [PubMed] [Google Scholar]
- 8.Binkley TL, Specker BL. pQCT measurement of bone parameters in young children:validation of technique. J Clin Densitom. 2000;3:9–14. doi: 10.1385/jcd:3:1:009. [DOI] [PubMed] [Google Scholar]
- 9.Schiessl H, Ferretti JL, Tysarczyk-Niemeyer G, Willnecker J. 1996 Noninvasive bone strength index as analyzed by peripheral quantitative computed tomography. Schoenau E, ed. In Paediatric Osteology. Elsevier Science, Amsterdam. :141–145. [Google Scholar]
- 10.Ferretti JL. 1997 Noninvasive assessment of bone architecture and biomechanical properties in animals and humans employing pQCT technology. J Jpn Soc Bone Morphom. 7:115–125. [Google Scholar]
- 11.Adams JE, Engelke K, Zemel BS, Ward KA. International Society of Clinical Densitometry. Quantitative computer tomography in children and adolescents:the 2013 ISCD Pediatric Official Positions. J Clin Densitom. 2014;17:258–74. doi: 10.1016/j.jocd.2014.01.006. [DOI] [PubMed] [Google Scholar]
- 12.Roggen I, Roelants M, Sioen I, Vandewalle S, De Henauw S, Goemaere S, Kaufman JM, De Schepper J. Pediatric reference values for tibial trabecular bone mineral density and bone geometry parameters using peripheral quantitative computed tomography. Calcif Tissue Int. 2015;96(6):527–33. doi: 10.1007/s00223-015-9988-2. [DOI] [PubMed] [Google Scholar]
- 13.Binkley TL, Specker BL, Wittig TA. Centile curves for bone densitometry measurements in healthy males and females ages 5-22 yr. J Clin Densitom. 2002;5(4):343–53. doi: 10.1385/jcd:5:4:343. [DOI] [PubMed] [Google Scholar]
- 14.Moyer-Mileur LJ, Quick JL, Murray MA. Peripheral quantitative computed tomography of the tibia:pediatric reference values. J Clin Densitom. 2008;11(2):283–94. doi: 10.1016/j.jocd.2007.11.002. [DOI] [PubMed] [Google Scholar]
- 15.Kułaga Z, Grajda A, Gurzkowska B, Góźdź M, Wojtyło M, Świąder A, Różdżyńska-Świątkowska A, Lit-win M. Polish 2012 growth references for preschool children. Eur J Pediatr. 2013;172:753–61. doi: 10.1007/s00431-013-1954-2. [DOI] [PMC free article] [PubMed] [Google Scholar]
- 16.Kułaga Z, Litwin M, Tkaczyk M, Palczewska I, Zajączkowska M, Zwolińska D, Krynicki T, Wasilewska A, Moczulska A, Morawiec-Knysak A, Barwicka K, Grajda A, Gurzkowska B, Napieralska E, Pan H. Polish 2010 growth references for school-aged children and adolescents. Eur J Pediatr. 2011;170:599–609. doi: 10.1007/s00431-010-1329-x. [DOI] [PMC free article] [PubMed] [Google Scholar]
- 17.Louis O, Willnecker J, Soykens S, Van den Winkel P, Osteaux M. Cortical thickness assessed by peripheral quantitative computed tomography:accuracy evaluated on radius specimens. Osteoporos Int. 1995;5(6):446–9. doi: 10.1007/BF01626606. [DOI] [PubMed] [Google Scholar]
- 18.Blew RM, Lee VR, Farr JN, Schiferl DJ, Going SB. Standardizing evaluation of pQCT image quality in the presence of subject movement:qualitative versus quantitative assessment. Calcif Tissue Int. 2014;94:202–11. doi: 10.1007/s00223-013-9803-x. [DOI] [PMC free article] [PubMed] [Google Scholar]
- 19.Cole TJ. The LMS method for constructing normalized growth standards. Eur J Clin Nutr. 1990;44:45–60. [PubMed] [Google Scholar]
- 20.Pan H, Cole TJ. LMSchartmaker a program to construct growth references using the LMS method. Version 2.54. [Accessed 15 Sept. 2016]. http://www.healthforallchildren.com .
- 21.Cole TJ, Green PJ. Smoothing reference centile curves:the LMS method and penalized likelihood. Stat Med. 1992;11:1305–1319. doi: 10.1002/sim.4780111005. [DOI] [PubMed] [Google Scholar]
- 22.Indrayan A. Demystifying LMS and BCPE methods of centile estimation for growth and other health parameters. Indian Pediatr. 2014;51:37–43. doi: 10.1007/s13312-014-0310-6. [DOI] [PubMed] [Google Scholar]
- 23.Neu CM, Manz F, Rauch F, Merkel A, Schoenau E. Bone densities and bone size at the distal radius in healthy children and adolescents:a study using peripheral quantitative computed tomography. Bone. 2001;28:227–32. doi: 10.1016/s8756-3282(00)00429-4. [DOI] [PubMed] [Google Scholar]
- 24.Frost, HM, Ferretti, JL, Jee WS. Perspectives:Some roles of mechanical usage, muscle strength, and the mechanostat in skeletal physiology, disease, and research. Calcif Tissue Int. 1998;62:1–7. doi: 10.1007/s002239900384. [DOI] [PubMed] [Google Scholar]
- 25.Roggen I, Roelants M, Sioen I, Vandewalle S, De Henauw S, Goemaere S, Kaufman JM, De Schepper J. Erratum to:Pediatric Reference Values for Tibial Trabecular Bone Mineral Density and Bone Geometry Parame-ters Using Peripheral Quantitative Computed Tomography. Calcif Tissue Int. 2015;97(4):426–7. doi: 10.1007/s00223-015-0047-9. [DOI] [PubMed] [Google Scholar]
- 26.Gurzkowska B, Grajda A, Kułaga Z, Napieralska E, Litwin M. Distribution of body mass index categories among Polish children and adolescents from rural and urban areas. Med Wieku Rozwoj. 2011;15:250–7. [PubMed] [Google Scholar]
- 27.Grajda A, Kułaga Z, Gurzkowska B, Napieralska E, Litwin M. Regional differences in the prevalence of overweight, obesity and underweight among polish children and adolescents. Med Wieku Rozwoj. 2011;15:258–65. [PubMed] [Google Scholar]
- 28.Rittweger J, Michaelis I, Giehl M, Wusecke P, Felsenberg D. Adjusting for the partial volume effect in cortical bone analyses of pQCT images. J Musculoskelet Neuronal Interact. 2004;4:436–41. [PubMed] [Google Scholar]
- 29.Neu CM, Rauch F, Manz F, Schoenau E. Modeling of cross-sectional bone size, mass and geometry at the proximal radius:a study of normal bone development using peripheral quantitative computed tomography. Osteoporos Int. 2001;12:538–47. doi: 10.1007/s001980170074. [DOI] [PubMed] [Google Scholar]
- 30.Fujita T, Fujii Y, Goto B. Measurement of forearm bone in children by peripheral computed tomography. Calcif Tissue Int. 1999;64:34–9. doi: 10.1007/s002239900575. [DOI] [PubMed] [Google Scholar]
- 31.Ashby RL, Ward KA, Roberts SA, Edwards L, Mughal MZ, Adams JE. A reference database for the Stratec XCT-2000 peripheral quantitative computed tomography (pQCT) scanner in healthy children and young adults aged 6-19 years. Osteoporos Int. 2009;20:1337–46. doi: 10.1007/s00198-008-0800-2. [DOI] [PubMed] [Google Scholar]


