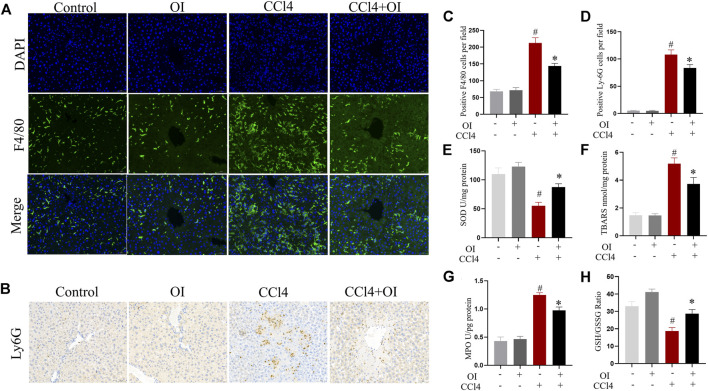
FIGURE 2.
Effect of OI on the infiltration of innate immune cells and oxidative stress in mice. (A) Immunofluorescence detection of F4/80-positive cells in hepatic sections from each group; DAPI was used to show nucleus. (B) Immunohistochemical detection of Ly6G-positive cells in liver sections of each group. (C) Positive F4/80 cells per field were analyzed for five visual fields per liver sections from each group. (D) Positive Ly6G cells per field were analyzed in five visual fields per liver section from each group. (E) The activities of SOD were measured in each group. (F) TBARS levels were measured in each group. (G) Activities of MPO were evaluated in each group. (H) The GSH/GSSG ratio was measured in each group. Original magnification, ×200. Data are expressed as mean ± SEM (n = 5 for each group); #p < 0.05 vs. control group; *p < 0.05 vs. CCl4-treated group.

