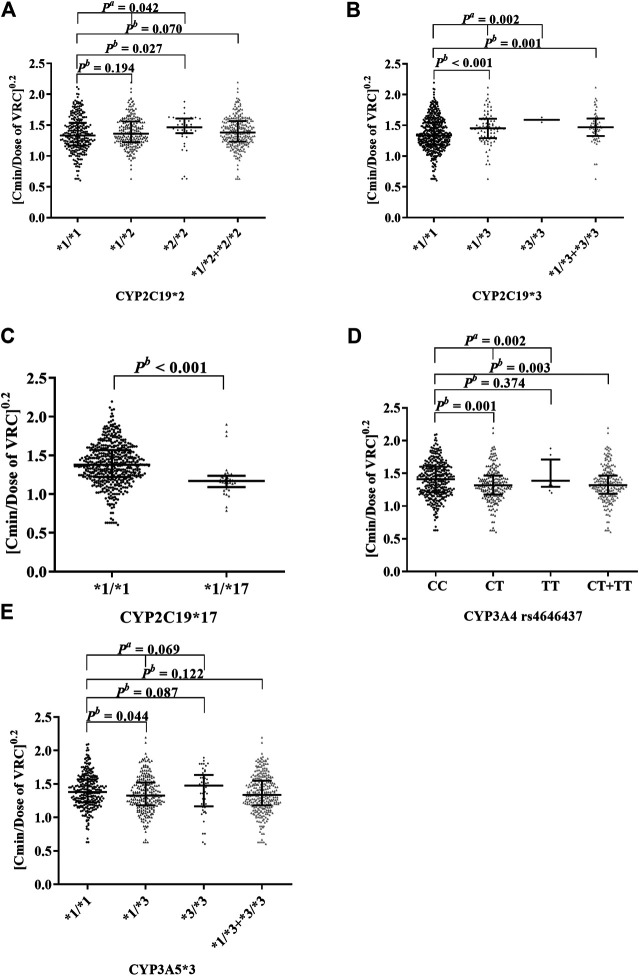
FIGURE 2.
Effects of cytochrome P450 polymorphisms on the C/D ratio of VRC. The data were non-normal distribution and expressed as median with interquartile range. The ordinate (C/D ratio of VRC) was processed to the power of 0.2. Data showed in Supplemental Table S3. (A) showed that the comparison between CYP2C19*1/*1 (n = 286), CYP2C19*1/*2 (n = 228), and CYP2C19*2/*2 (n = 41) was significant (p a = 0.042). (B) showed that the CYP2C19*1/*3 + CYP2C19*3/*3 (n = 83) can increase the C/D ratio of VRC significantly compared to CYP2C19*1/*1 (n = 472, p b = 0.001). (C) showed that the CYP2C19*1/*17 (n = 35) can reduce the C/D ratio of VRC significantly compared to CYP2C19*1/*1 (n = 520, P b < 0.001). (D) showed that the comparison between CYP3A4 genotype CC (n = 338) and CT + TT (n = 217) had statistical differences (P b = 0.003). (E) showed that the comparison between CYP3A5*1/*1 (n = 267), CYP3A5*1/*3 (n = 240), and CYP3A5*3/*3 (n = 48) was insignificant (P a = 0.069).

