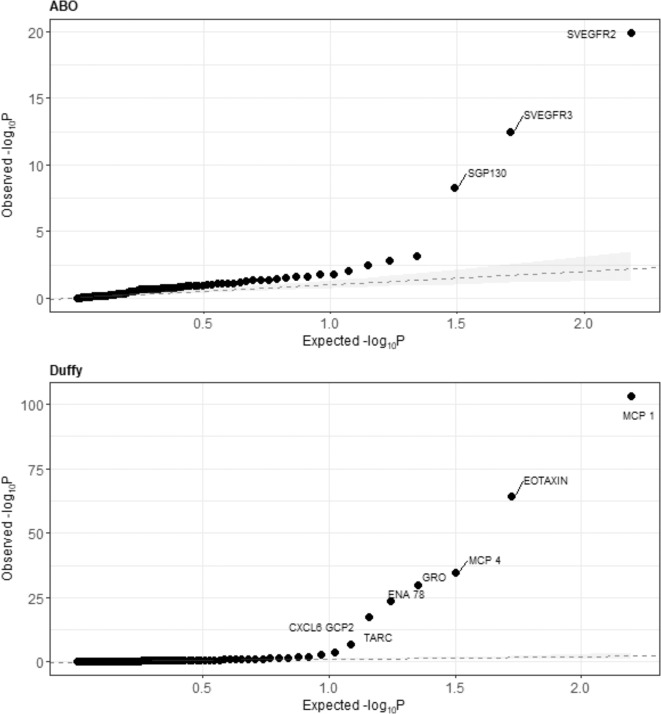
Fig. 1. Observed versus expected distribution of p values for associations between circulating inflammatory markers and blood antigen groups.
Each dot represents the joint Wald test of a linear or logistic model predicting marker concentration from blood type, adjusting for sex, age (5-year category), smoking status (never/former/current), study, and the first-five principal components of population substructure. Labeled points denote associations which were significant after Bonferroni correction. Shaded bands represent a bootstrapped 95% confidence interval generated from 10,000 replicates, and dotted lines represent predicted empirical distribution. Note different y-axis scales for top and bottom figures.

