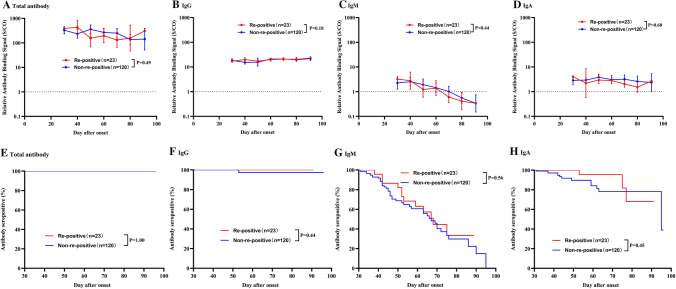
Fig. 2.
Comparison of antibody kinetics in COVID-19 patient with and without re-positive RT-PCR results during the convalescent phase. Comparison of antibody levels: A total antibody, B IgG antibody, C IgM antibody, D IgA antibody. P-values were estimated using multivariable log-binomial regression models with generalized estimating equations adjusted for age and days after symptom onset. Kaplan-Meier curves comparing the prevalence of seropositivity: E total antibody, F IgG antibody, G IgM antibody, H IgA antibody. P-values were estimated using the log-rank test

