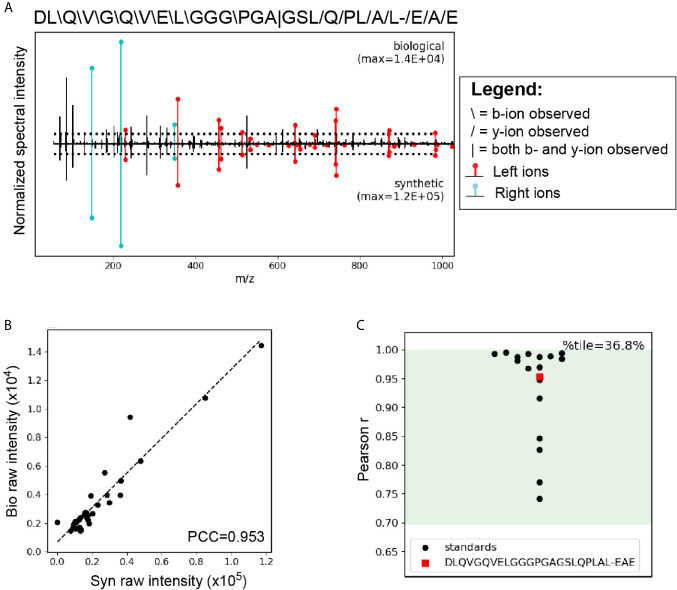
Figure 6.
LC-MS/MS analysis using the P-VIS approach confirms that HIP11 is present in human islets. Proteins were extracted from human islets, fractionated by size exclusion chromatography (SEC), and digested with the protease AspN, which cleaves at the N-terminus of aspartic acid (D) residues. Samples were analyzed by LC-MS/MS and data were searched using Agilent Spectrum Mill software. The predicted HIP11 AspN cleavage product DLQVGQVELGGGPGAGSLQPLAL-EAE was identified with high confidence and validated using the P-VIS approach. (A) Mirror plot generated by PSM_validator displaying the spectrum from the biological sample (positive y-axis) and the spectrum from the validation sample (negative y-axis). Peak intensities are normalized to the most intense peak in each spectrum. The intensity of the tallest peak in each spectrum is indicated. In the sequence map, “”, “/”, and “|” indicate that the spectrum from the biological sample contained a b-ion, y-ion, or both, respectively, corresponding to fragmentation at a given bond. Horizontal dotted lines indicate the user-defined threshold for consideration of peaks in the Pearson correlation coefficient (PCC) calculation. Ions corresponding to fragmentation of a bond to the left (L ions) or right (R ions) of the hybrid junction are labeled in red and cyan, respectively. (B) Peaks that were present above the intensity threshold in at least one of the spectra were used to calculate the Pearson correlation coefficient (PCC) between the two spectra. For each peak, the intensity in the biological peptide spectrum (bio raw intensity) and the intensity in the spectrum for the synthetic peptide (syn raw intensity) were paired, and the pairs for all peaks were plotted. Calculation of the PCC for these values indicated that the spectra were highly correlated (PCC = 0.953). (C) Comparison of the PCC for the HIP11 match to the distribution of PCCs for internal standard peptides (ISPs). Data for the ISPs passed the D’Agostino-Pearson omnibus normality test (p = 0.229; p > 0.05 indicates that the null hypothesis cannot be rejected and the data can be treated as normal). Green shading indicates the 95% prediction interval based on one-tailed analysis of Fisher’s z-transformed PCC values. The PCC comparing the biological spectrum and the validation spectrum is shown (red square), and the percentile (%tile) is reported.

