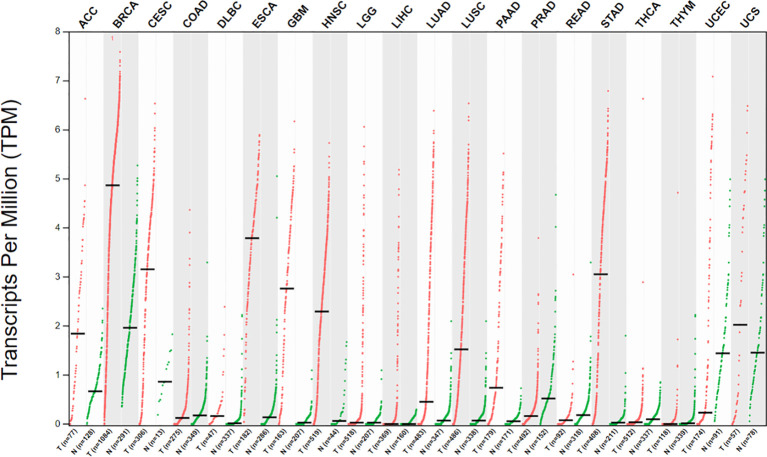
Figure 2.
Dot plot showing different HOXC10 expression across 20 tumor samples and paired normal tissues. Each dots represents expression of samples. (X-axis: cancer type, Y-axis: log2[TPM + 1]) Tumors data are from the Cancer Genome Atlas (TCGA), and normal data are from the TCGA and GTEx database. Data were visualized using GEPIA2.0 (http://gepia2.cancer-pku.cn/).

