Figure 3.
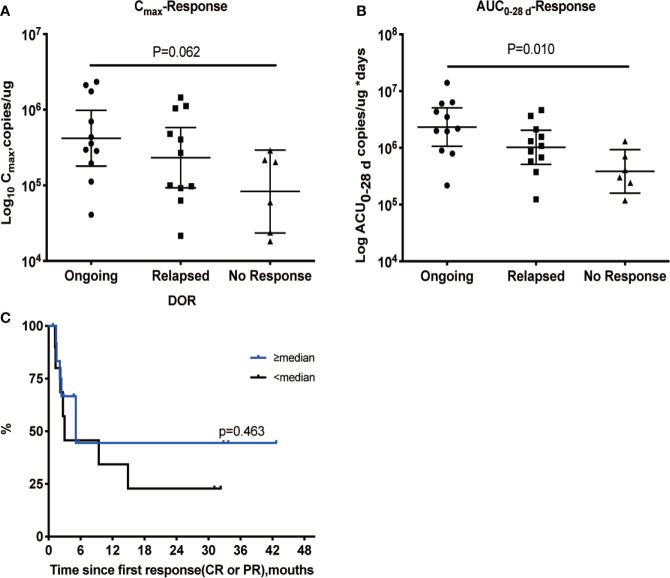
Relationship between cellular kinetics and response. Relationship between Cmax (A) and AUC0–28 d (B). DOR in patients with a response (C). Patients with an ongoing response at the last follow-up day had higher Cmax (A) and AUC0–28 d values (B). Patients with a higher-than-median Cmax had a potentially longer DOR than those with lower-than-median Cmax, but the differences were not statistically significant (P = 0.463) (C).

