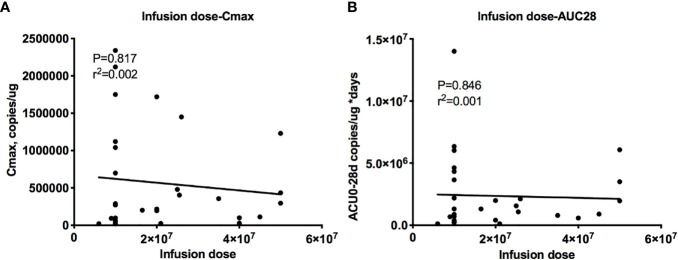
Figure 5.
Relationship between the dose and cellular kinetics. Relationships between the infusion dose and Cmax (A) and AUC0–28 d (B). The dose-exposure analysis showed a flat relationship between the dose and cellular kinetic parameters, with r2 = 0.004 for Cmax (A) and r2 = 0.002 for AUC0–28 d (B).

