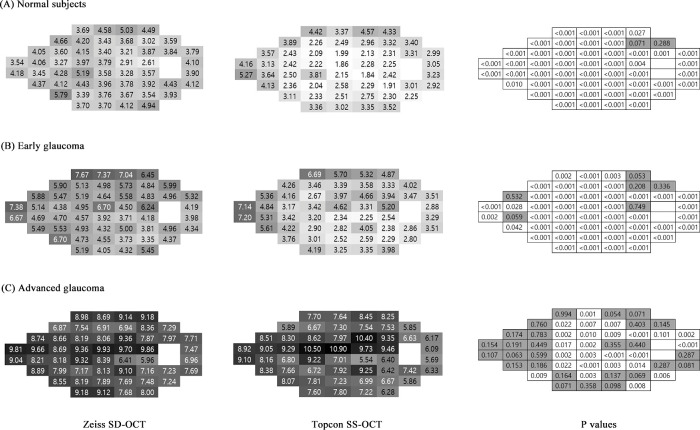
Figure 5.
Pointwise RMSE between ground truth and the estimated value. In left and middle column, the darker the color is, the higher estimation error. Right column shows pointwise P values (the darker color means insignificant) comparing two OCTs (Wilcoxon's signed rank test). SS-OCT, swept source OCT.

