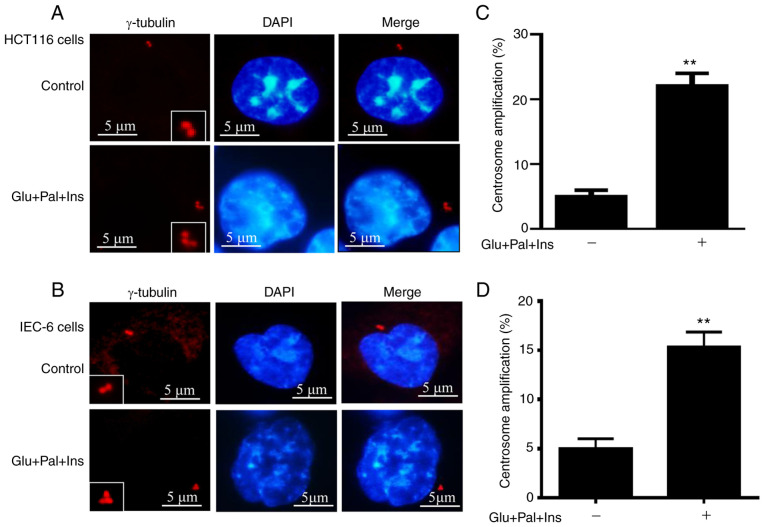
Figure 1.
High Glu, Ins and Pal trigger centrosome amplification. HCT116 and IEC-6 cells were treated for 48 h, and centrosomes were visualized via immunofluorescent staining using an antibody against γ-tubulin. Representative images of centrosomes are shown in (A) HCT116 and (B) IEC-6 cells. Percentages of cells with centrosome amplification was increased in (C) HCT116 and (D) IEC-6 cells following treatment. In total, 200 cells were evaluated for centrosome quantification. Percentage of centrosome amplification=(the number of cells with centrosome amplification/200) ×100. **P<0.01. Glu, glucose, 15 mM; Ins, insulin, 5 nM; Pal, palmitic acid, 150 µM.

