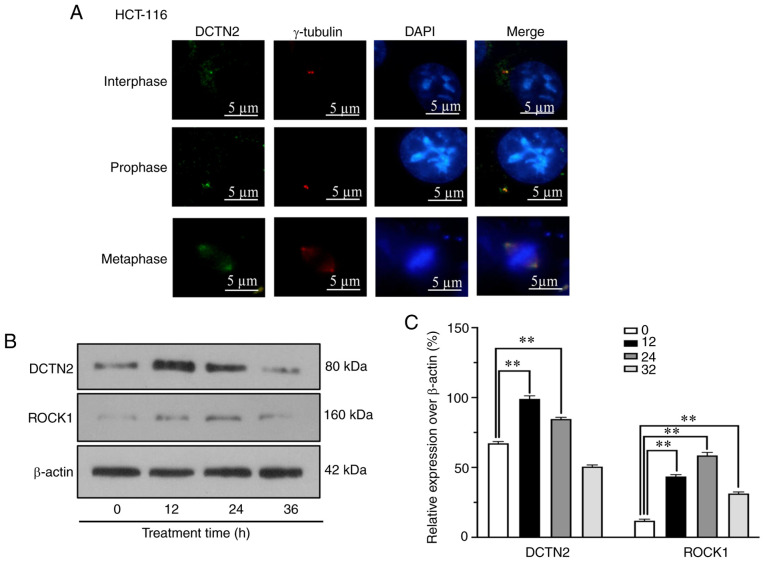
Figure 3.
Centrosomal localization and the treatment-induced upregulation of the of ROCK1 and DCTN2 expression in HCT116 cells. (A) DCTN2 was localized to the centrosome in ~100% of the 300 cells counted. Treatment with high glucose, insulin and palmitic acid increased the expression levels of (B) ROCK1 and (C) DCTN2. **P<0.01. ROCK1, Rho-associated protein kinase 1; DCTN2, dynactin subunit 2.

