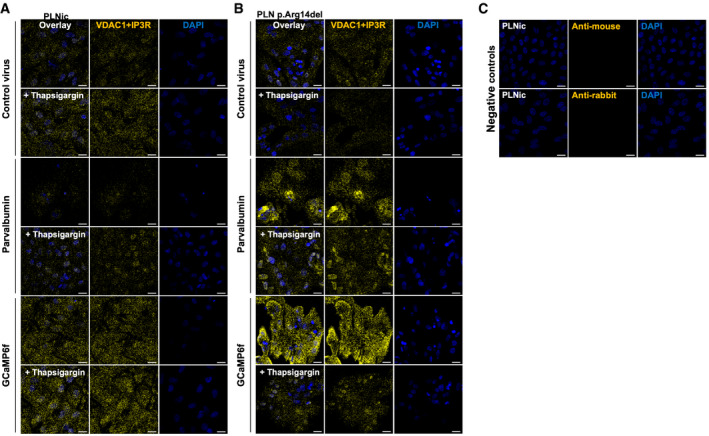
Figure EV2. Investigation of protein–protein interaction.

-
A, BProximity ligation assays (PLAs; yellow) combining an anti‐VDAC1 (localizing to the outer mitochondrial membrane) and an IP3R‐antibody (localizing to the ER) and DAPI staining of nuclei (blue) at baseline and after thapsigargin (1.0 µM, 5 h) exposure for PLNic (A) and PLN p.Arg14del (B) after transduction with control, GCaMP6f, or parvalbumin virus.
-
CNegative control: Anti‐mouse, anti‐rabbit antibodies alone. Scale bar 20 µm.
