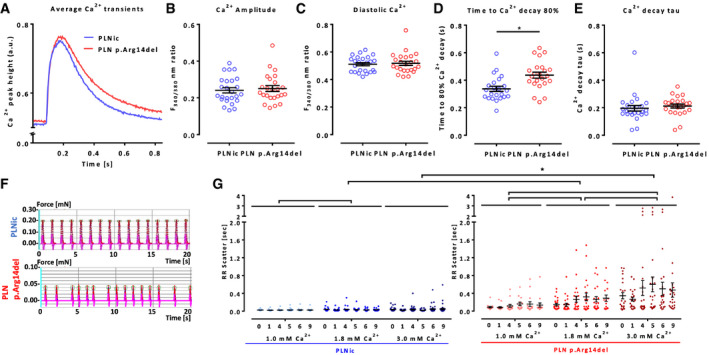
GRR scatter (surrogate for irregular beating pattern, IBP, interdecile range of mean beat‐to‐beat distance) of PLNic and PLN p.Arg14del EHT at 1.0, 1.8, and 3.0 mM extracellular Ca2+ concentration, incubation time 9 h, recording time 50 s, PLNic: 1.0 mM: n = 24/3, 1.8 mM: n = 32/4, 3.0 mM: n = 41/5 (EHT/batches), PLN p.Arg14del: 1.0 mM: n = 15/2, 1.8 mM: n = 24/3, 3.0 mM: n = 23/3 (EHT/batches), mean ± SEM, two‐way ANOVA (comparing hiPSC lines and Ca2+ concentrations (but not time points)) with Tukey’s post hoc test, *P < 0.05. The data are representative of n = 5 independent experiments.

