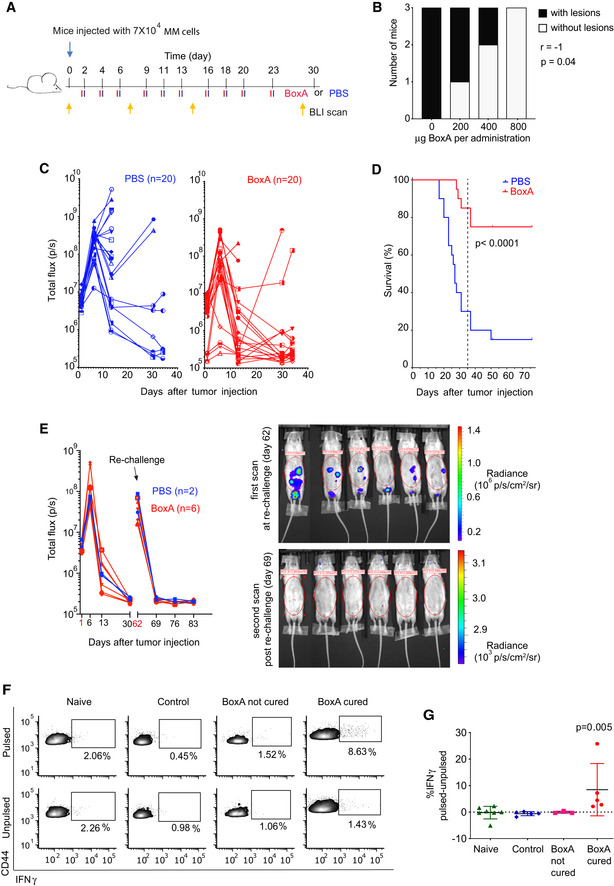
Figure 1. BoxA increases survival and induces immunization in a syngeneic mouse model of mesothelioma.

-
AScheme of the experiment. BALB/c mice were inoculated i.p. with 7 × 10⁴ MM cells and treated with either 800 µg BoxA (red bars) or PBS (blue bars) three times a week, 10 times in total. Yellow arrows represent BLI imaging.
-
BTreatment with BoxA at increasing doses reduced the number of mice with detectable tumor lesions in a statistically significant dose‐dependent manner (Spearman correlation: P = 0.04). In this experiment, no BLI measurement was taken.
-
CForty mice were inoculated with MM cells and treated or not with BoxA. Tumor growth was detected via BLI. Lines that do not reach day 34 correspond to mice that were sacrificed for ethical reasons.
-
DKaplan–Meier survival curves. Statistics: log‐rank Gehan–Breslow–Wilcoxon test, P < 0.0001, n = 20 per group.
-
ETumor growth after MM re‐challenge detected by BLI.
-
F–GFlow cytometry analysis of luciferase‐specific T cells. In (F), representative dot plots depict intracellular IFNγ levels in gated CD8+ CD44high T cells. In (G), differences in the percentage of IFNγ producing CD8+ CD44high cells, pulsed relative to unpulsed. Statistics: Kruskal–Wallis test; each dot represents a mouse (n = 3–7 per group); bars represent mean ± SD.
Source data are available online for this figure.
