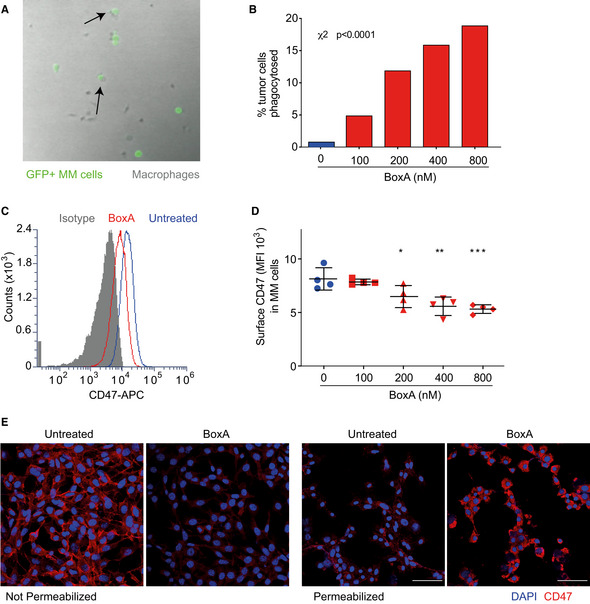
Figure 4. MM cells exposed to BoxA are phagocytosed by macrophages following CD47 internalization.

- Representative frame of a 16‐h time‐lapse microscopy experiment; GFP+ MM cells (green) were co‐cultured with mouse bone marrow‐derived macrophages (gray) in the presence of 200 nM BoxA. Arrows indicate GFP+ MM cells engulfed by macrophages. This experiment was repeated twice.
- Fraction of phagocytosed GFP+ MM cells after 16 h. Statistics: χ2 test, phagocytosed versus non‐phagocytosed MM cells (n = 68 to 158).
- Surface CD47 in MM cells, untreated (blue) or treated for 24 h with 800 nM BoxA (red). Control isotype (gray).
- Surface CD47 on MM cells evaluated by flow cytometry after incubation for 24 h with the indicated concentrations of BoxA. The experiment shown is representative of three performed. Error bars indicate standard deviation. Statistics: One‐way ANOVA plus Dunnett’s post‐test. *P < 0.05, **P < 0.01, ***P < 0.001.
- Representative immunofluorescence staining of CD47 (red) in unpermeabilized and permeabilized MM cells treated or not with 800 nM BoxA for 24 h. Nuclei are counterstained with DAPI. Scale bar 50 µm.
Source data are available online for this figure.
