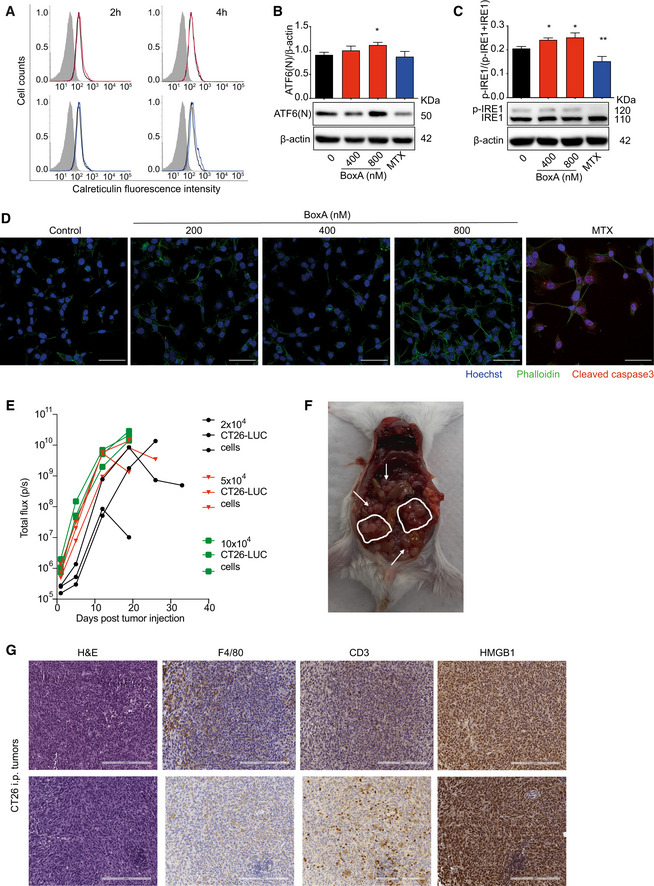
Figure EV5. BoxA exerts therapeutic effects in a syngeneic model of colon cancer.

- Flow cytometry analysis of ecto‐calreticulin on the surface of CT26 cells exposed to 800 nM BoxA (red line) or 1 µM MTX (blue line) for 2 or 4 h, compared to untreated cells (black line); control isotype is shown in gray.
- Western blot and quantification of the nuclear form of ATF6(N) relative to β‐actin in CT26 cells treated with BoxA (400 and 800 nM) or MTX (1 µM) for 24 h. The experiments shown are representative of three performed. Error bars indicate standard deviation. Statistics (one‐way ANOVA plus Dunnett’s post‐test) refers to pooled data from the three experiments. *P < 0.05.
- Western blot of p‐IRE1 relative to total IRE1 in CT26 cells treated as in B. β‐actin is shown as loading control. The experiments shown are representative of three performed. Error bars indicate standard deviation. Statistics (one‐way ANOVA plus Dunnett’s post‐test) refers to pooled data from the three experiments. *P < 0.05, **P < 0.01.
- Confocal immunofluorescence microscopy of cleaved caspase‐3 (red) in CT26 cells treated with increasing doses of BoxA or MTX (1 µM) for 24 h. Nuclei were stained with Hoechst (blue) and cytosol with phalloidin (green). Scale bar 50 µm.
- Tumor growth followed by BLI in mice (n = 3 per group) injected i.p. with three different amounts of CT26‐LUC cells.
- Necroscopy of a mouse inoculated with 3.5 × 10⁴ CT26‐LUC cells (19 days post‐injection). White arrows and circles indicate tumor masses.
- Immunohistochemical survey of tumor microenvironment in CT26 colon cancers explanted from 2 mice; representative H&E and IHC staining. Scale bar, 200 µm.
Source data are available online for this figure.
