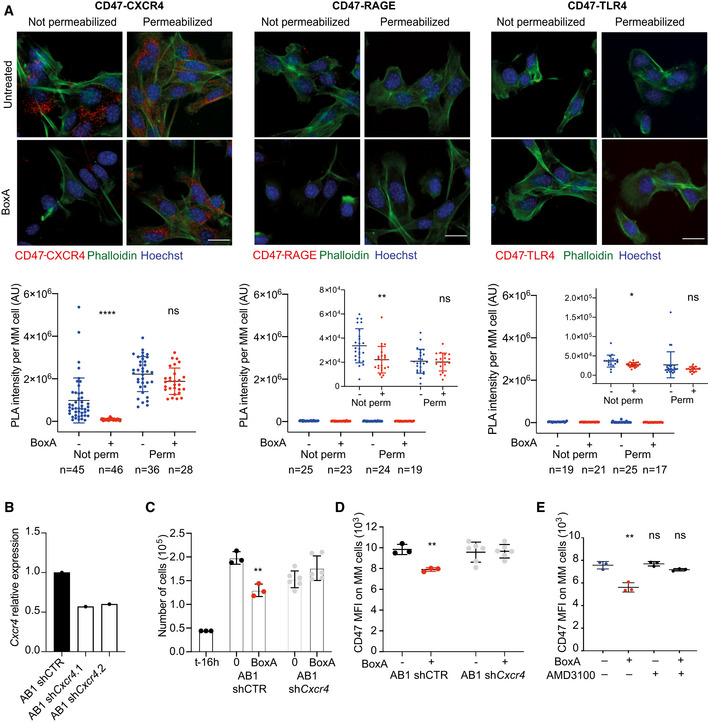
Figure 6. Engagement of CXCR4 by BoxA mediates CD47 internalization.

- Confocal images of Proximity Ligation Assays performed on CD47 and CXCR4, CD47 and RAGE, CD47 and TLR4. Representative images from one experiment out of three performed are shown. MM cells were incubated overnight with 400 nM BoxA or PBS. Nuclei are in blue (DAPI), phalloidin is in green. Red dots represent physical contact of CD47 with CXCR4 or RAGE or TLR4. Scale bar, 20 µm. The intensity of red signal in PLA was quantified as described in Materials and Methods in individual cells (n as indicated). Insets are enlargements of the y axis. Mean and SD are indicated. Statistics: Kolmogorov–Smirnov test.
- Cxcr4 mRNA expression in MM cells transfected with shCxcr4 (pools 1 and 2) relative to MM cells transfected with shScramble (AB1 shCTR), one biological replicate, in technical triplicate.
- Cell proliferation. shCTR (n = 3) and shCxcr4 MM cells (pools 1+2, n = 6) were plated (4.4 × 10⁴ at the start of the experiment, t‐16 h), treated or not with 800 nM BoxA for 24 h and counted. Statistics: t‐test.
- Flow cytometry analysis of surface CD47 in shCTR and shCxcr4 MM cells (pools 1+2) exposed or not to 800 nM BoxA for 24 h.
- Flow cytometry analysis of surface CD47 on MM cells after exposure to 800 nM BoxA and 100 nM AMD3100 for 24 h.
Data information: In panels (D, E) bars and error bars represent mean ± SD; statistics: One‐way ANOVA plus Tukey’s post‐test. In all panels, error bars indicate standard deviation; *P < 0.05, **P < 0.01, ***P < 0.001, ****P < 0.0001.
Source data are available online for this figure.
