
Figure 8.
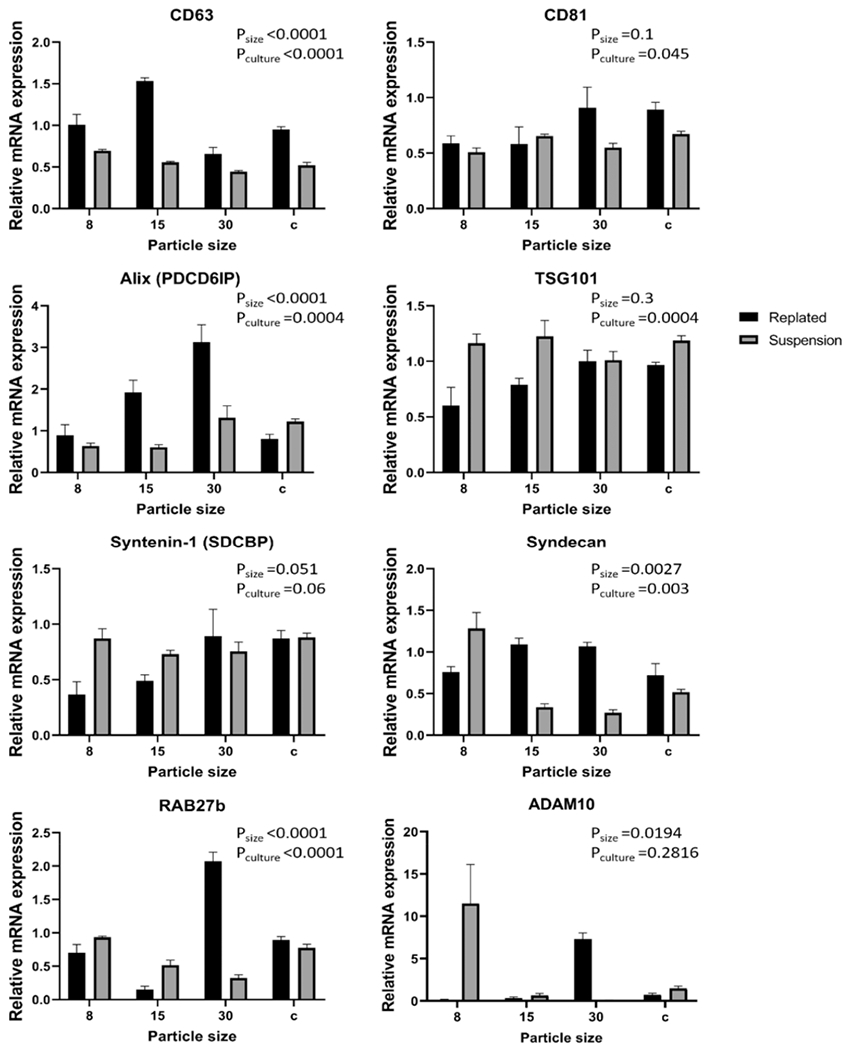
mRNA expression of EV biogenesis markers for replated or suspended cortical spheroids after the addition of iron oxide nanoparticles. The mRNA expression was normalized to one of the replicates of the control condition (i.e., replated cortical spheroids) (n = 3). Data are represented as mean ± SEM and statistical analysis was done using a two-way ANOVA.