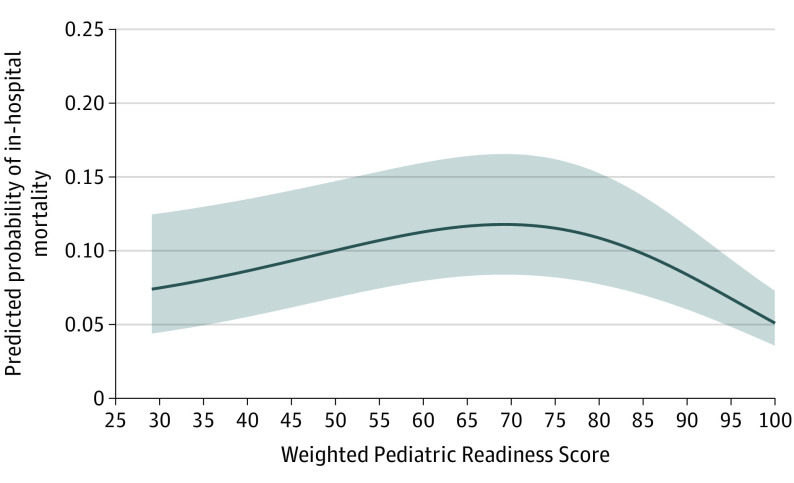
Figure 3. Adjusted In-Hospital Mortality for 372 004 Injured Children Across the Spectrum of Emergency Department (ED) Pediatric Readiness Using Best-Fit Fractional Polynomials.
The figure was generated using best-fit fractional polynomials to model the association between the weighted Pediatric Readiness Score and in-hospital mortality from the risk-adjustment model using a patient with the following characteristics: male, age 5 to 12 years, White race, no comorbidities, no surgical intervention, mean Injury Severity Score (ISS), motor vehicle crash mechanism, arrival by ambulance, no transfer, hypotension, Glasgow Coma Scale score 9 to 12, intubation, and blood transfusion. Graphs generated using patients with different characteristics were similar in shape, but with higher or lower values for predicted in-hospital mortality.

