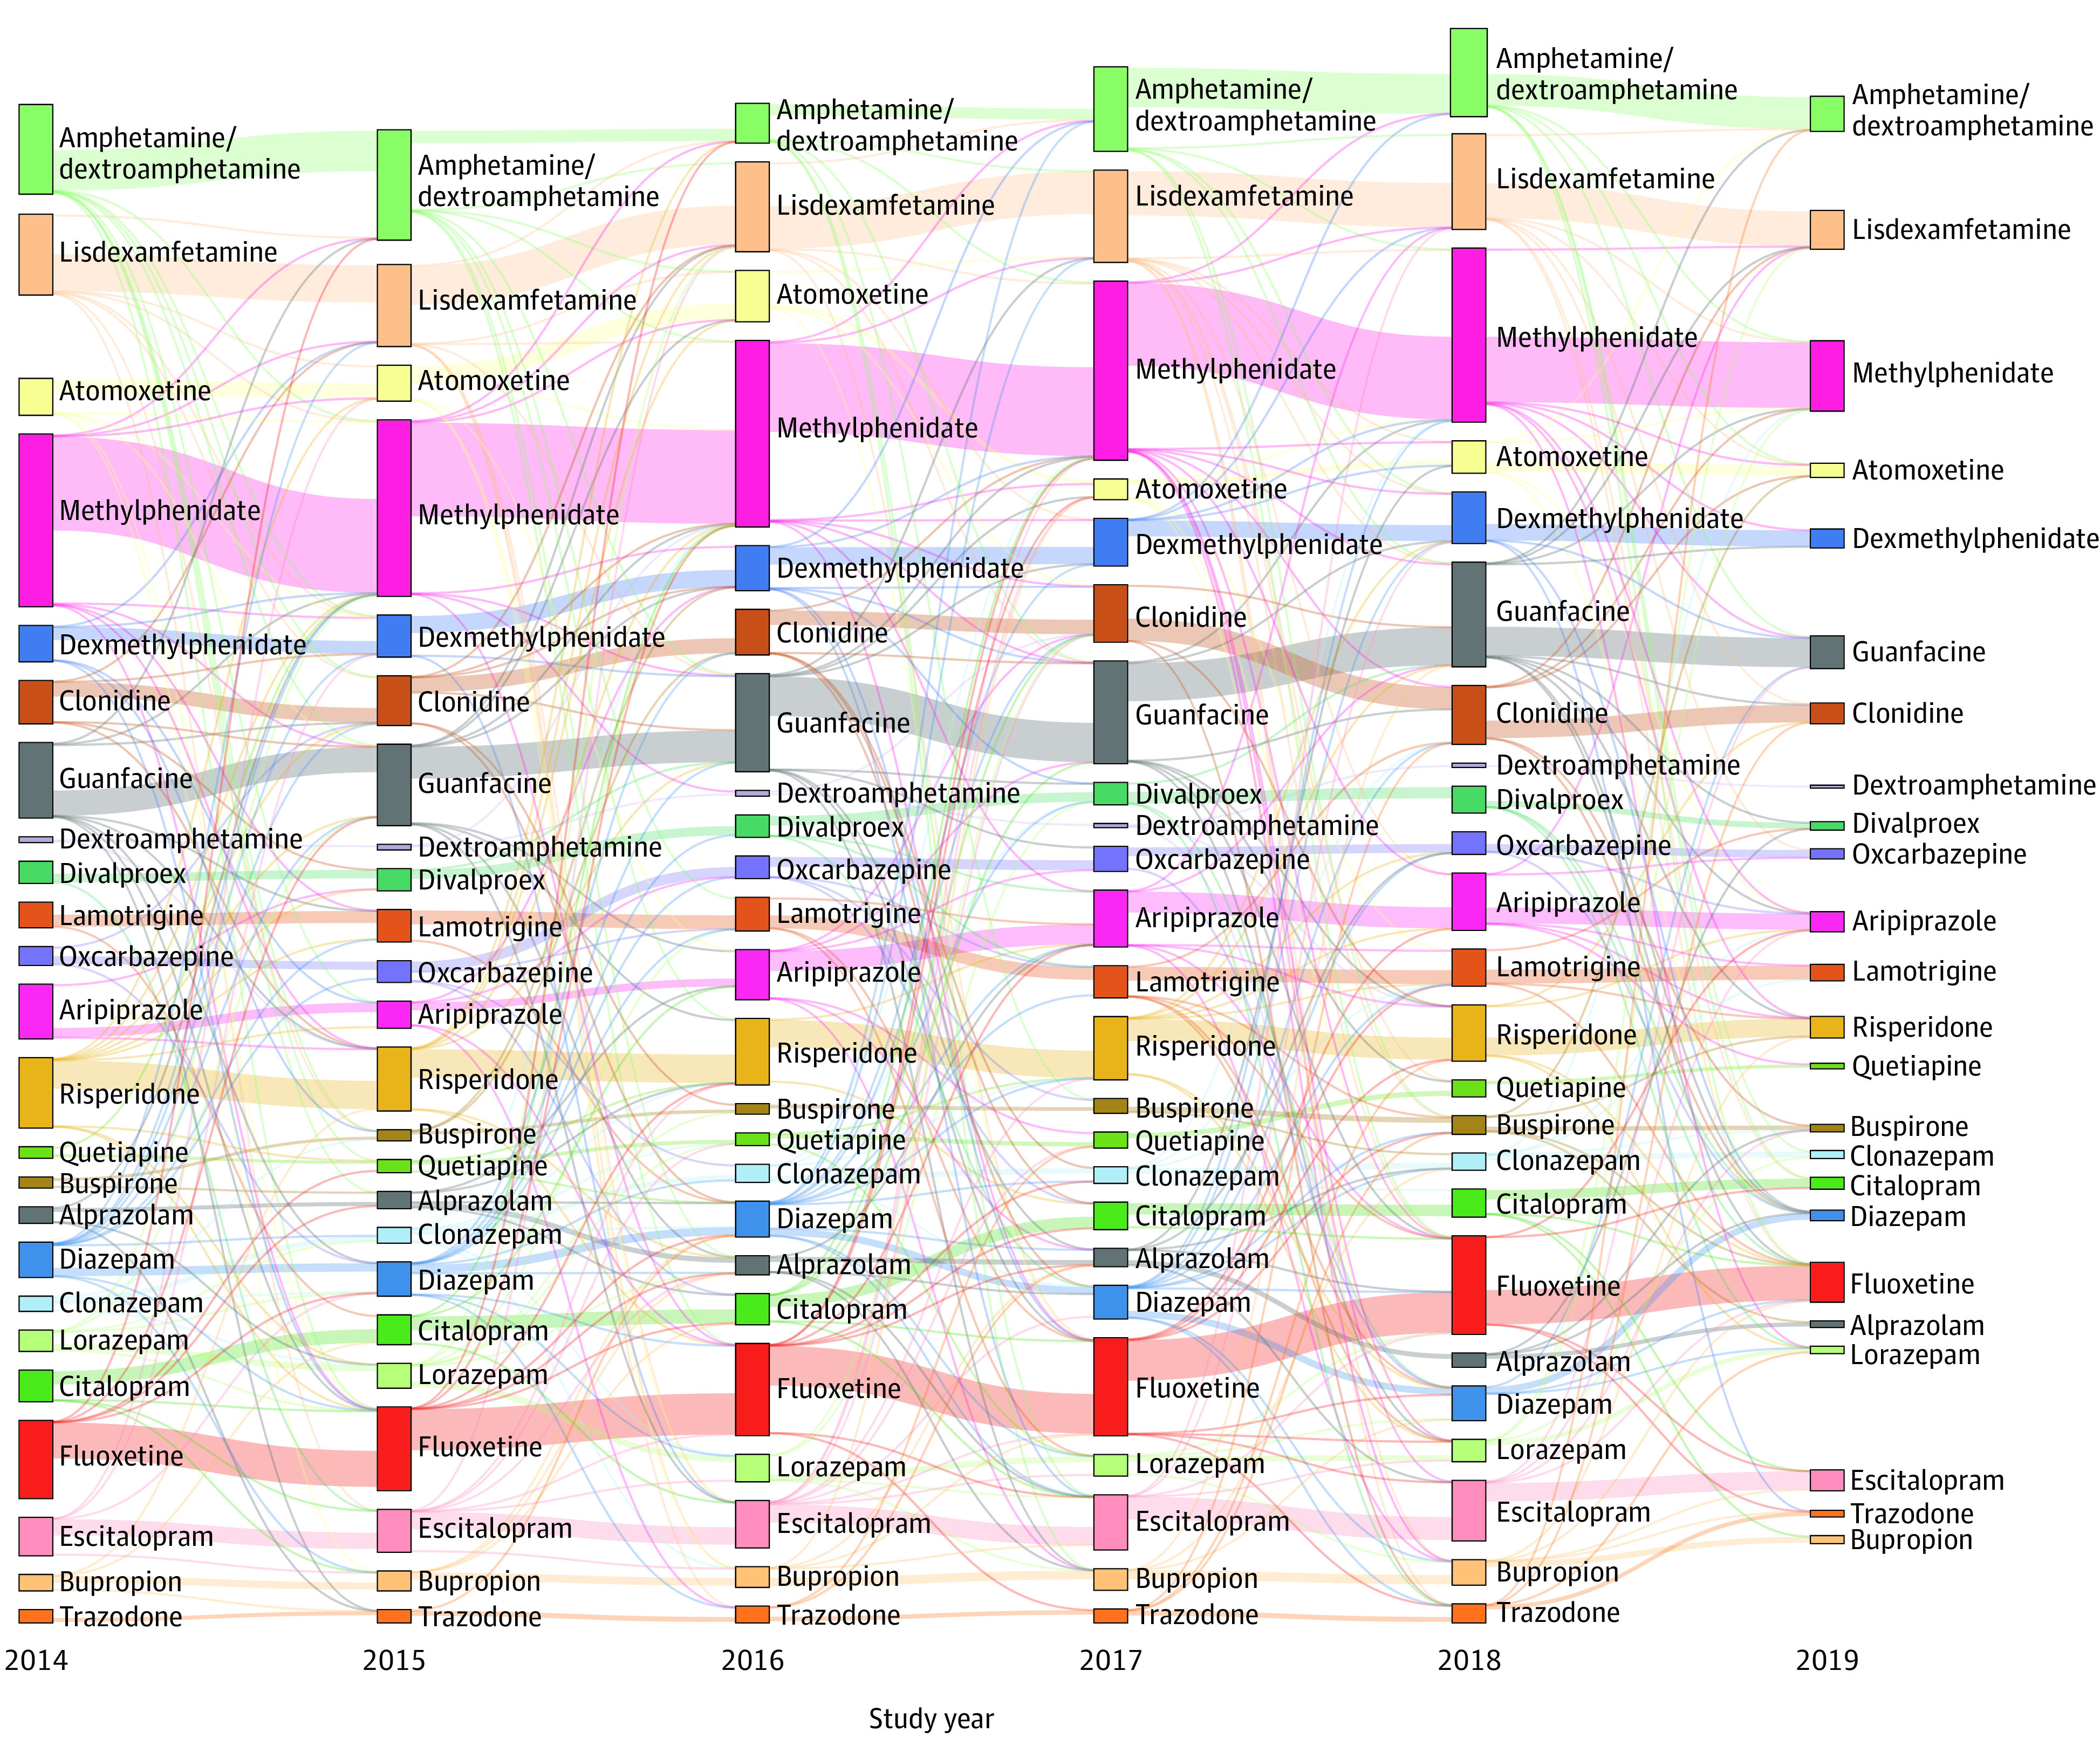
Figure 3. Trends in Prescription Drug Use Over Time.

This Sankey diagram36 only includes individuals who were prescribed a single drug in each of the listed years so the bars in each year are mutually exclusive. Medications are organized by drug class (eg, stimulants). The size of the vertical bars corresponds to the number of individuals exclusively prescribed that medication in that year. The lines between the vertical bars represent whether individuals took the same or another medication in the subsequent year. The width of the lines represents the relative proportion of individuals who continued taking a single drug in the following year (ie, if an individual used a drug not specified here or stopped taking a specified drug altogether, that individual would not be represented).
