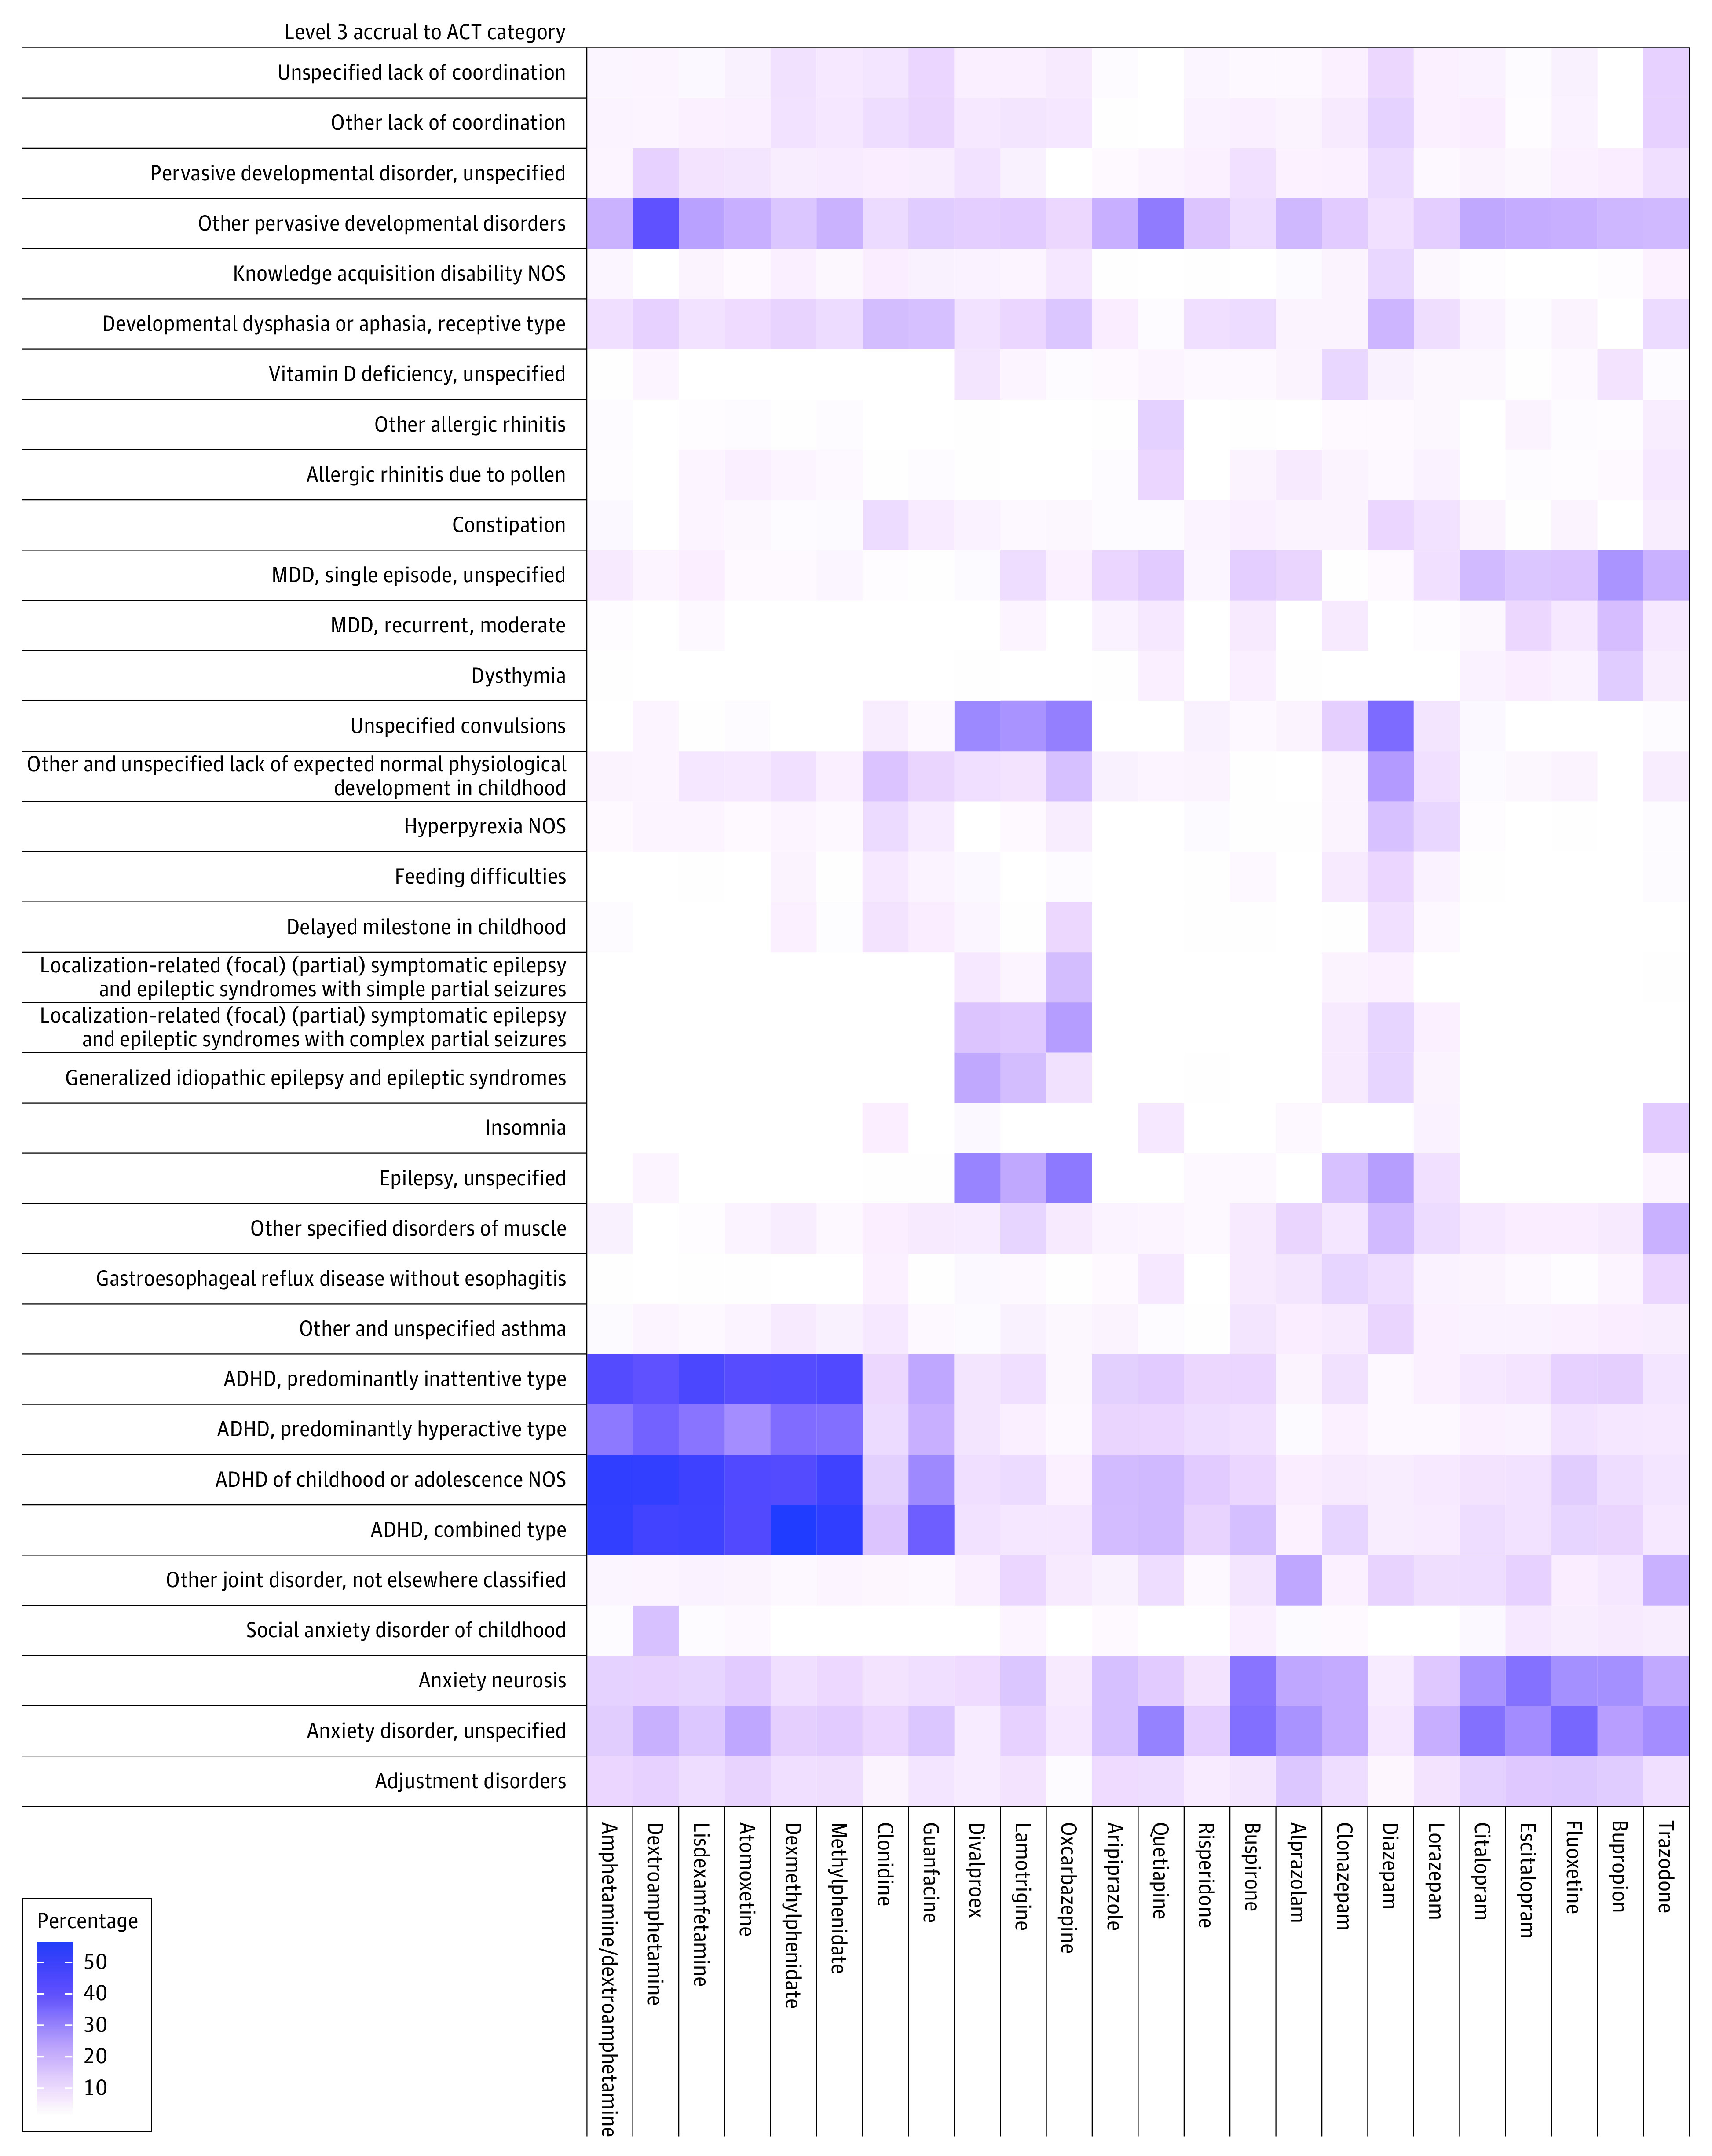
Figure 4. Heat Map of the Most Common Comorbidities for Each Drug of Interest.

Level 3 Accrual to Clinical Trials (ACT) categorizations are ordered by level 1 ACT category. The intensity of the color in each square (ie, the percentage) represents the relative proportion of individuals within each column (ie, a given prescription group) that also had the corresponding diagnostic categorization. Each column represents individuals in the study cohort taking only the corresponding medication during the 6-year study period. ADHD indicates attention-deficit/hyperactivity disorder; MDD, major depressive disorder; NOS, not otherwise specified.
