Fig. 3.
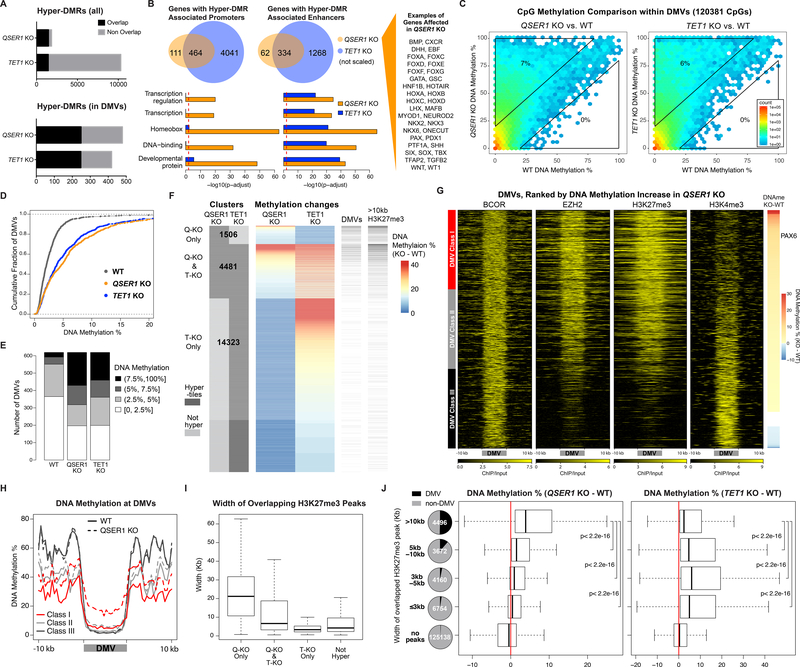
QSER1 and TET1 protect DNA methylation valleys. (A) Total and overlapping hyper-DMRs between QSER1 KO and TET1 KO. (B) Venn diagrams representing genes with hyper-DMR associated Promoters (left) or enhancers (right). Bar plots represent pathway enrichment analysis. Red line represents FDR cutoff 0.01. (C) Hexagon plots showing CpG methylation inside DMVs (KO vs. WT). (D) Cumulative fraction of DMVs according to average methylation of each DMV. (E) Bar plot showing DMVs in designated range of average methylation. (F) DNA methylation change at QSER1 KO and TET1 KO hyper-tiles. Number of hyper-tiles in each category is indicated. DMVs and broad H3K27me3 peak overlap are indicated. (G) Heatmaps of ChIP-seq signals (log2 ratio vs. input) at DMVs ranked by methylation increase in QSER1 KO. (H) Meta-signal plots of DNA methylation at DMV Classes and 10kb flanking regions for WT and QSER1 KO. (I-J) Box plots showing average width of H3K27me3 peaks that overlap with designated hyper-tiles and methylation difference (KO-WT) for tiles that overlap with designated H3K27me3 peaks. In box plots here and later, edges refer to the upper/lower quartiles and whiskers represent 1.5 interquartile range beyond edges; Mann-Whitney U-test was conducted. Pie charts show percentage of tiles that overlap with DMVs.

