Fig. 5.
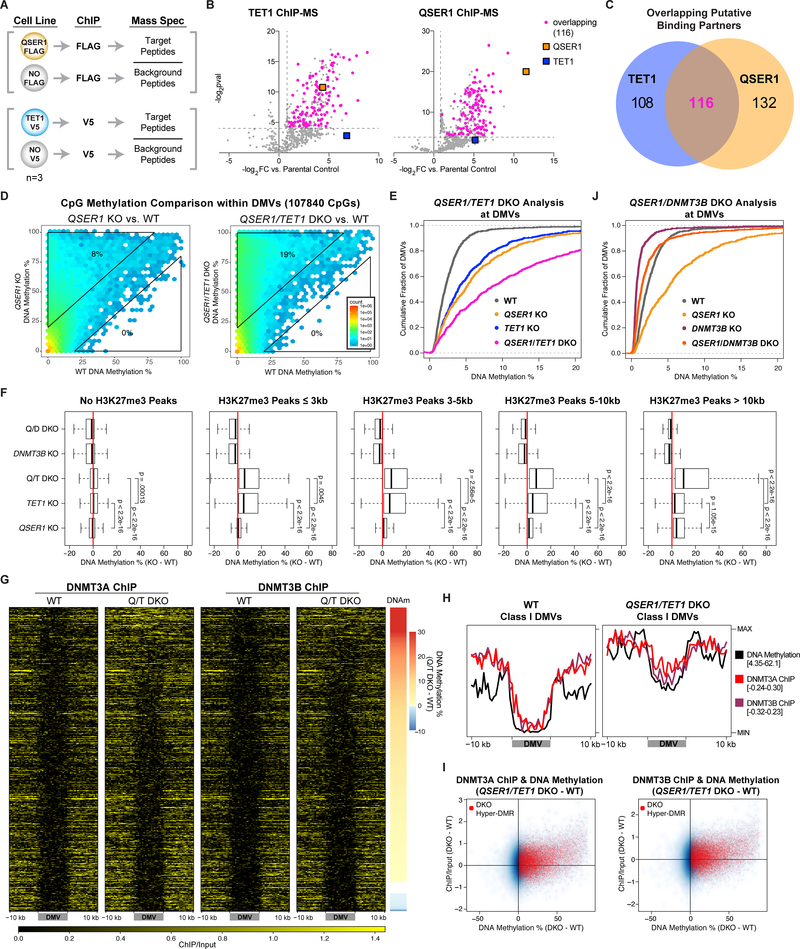
QSER1 and TET1 cooperate to inhibit DNMT3A/3B binding. (A) Schematic of ChIP-MS experiments. (B) Volcano plots showing identified and overlapping proteins in QSER1–3XFLAG and TET1-V5 IPs for ChIP-MS. Dotted lines represent the fold change and p value cutoffs for significantly enriched proteins. (C) Venn diagram showing the overlap of significantly enriched proteins in both IPs for ChIP-MS. (D) Hexagon plots showing methylation levels of CpGs inside DMVs for each KO or DKO compared to WT. (E, J) Cumulative fraction of DMVs plotted according to average methylation of each DMV. (F) Methylation difference (KO-WT) of 1-kb tiles that overlap with designated H3K27me3 peaks for specified genotypes. (G) Heatmaps of DNMT3A/3B ChIP-seq signals at DMVs in WT and QSER1/TET1 DKO ranked by methylation increase in DKO. (H) Meta-signal plots of ChIP-seq signals for DNMT3A/3B and DNA methylation levels at Class I DMVs in WT and QSER1/TET1 DKO. (I) 1-kb plots comparing ChIP-seq signal change vs. methylation change (QSER1/TET1 DKO – WT). Tiles that overlap with QSER1/TET1 DKO hyper-DMRs are highlighted in red.

