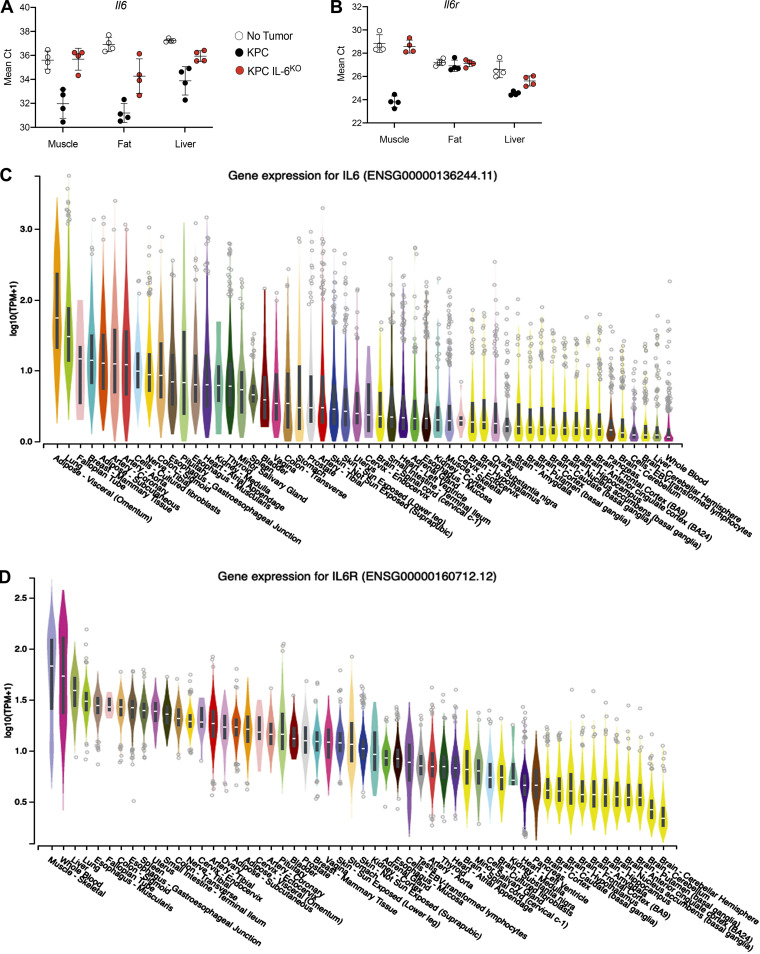
Figure S5.
Tissue Il6 and Il6r mRNA expression using mean Ct from qPCR and the GTEx Portal database support fat as a significant source of Il6 and muscle as a significant source of Il6r. (A) Comparison of Il6 mean Ct from qPCR analysis between groups for muscle, fat, and liver shows fat from KPC tumor mice with the lowest mean Ct, indicating the highest expression of Il6 among tissues analyzed. (B) Comparison of Il6r mean Ct from qPCR analysis between groups for muscle, fat, and liver shows muscle from KPC tumor mice with the lowest mean Ct, indicating the highest expression of Il6r among tissues analyzed. In A and B, error bars are mean plus SD. (C) Data represent single experiments. Human Il6 mRNA expression across various tissues according to the GTEx Portal Database shows adipose tissues as having the highest Il6 expression. (D) Human Il6r mRNA expression across various tissues according to the GTEx Portal Database shows skeletal muscle as having the highest Il6r expression.

