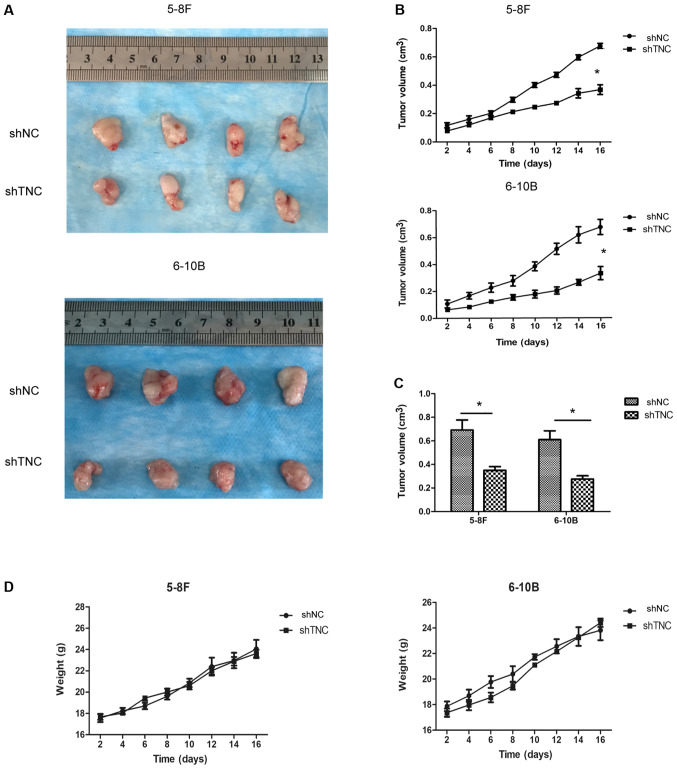
Figure 7.
Effects of TNC expression on tumor growth in xenografts. (A) Representative images of tumors that were removed from xenografts. (B) Tumor growth in the mice injected with the different cell lines. Tumor volume of different days in mice injected with shNC 5-8F and shTNC 5-8F groups, shNC 6-10B and shTNC 6-10B groups were compared, respectively. (C) Histogram presenting the average volume of tumors. (D) There were no significant differences in the average weight of the mice. *P<0.05. TNC, tenascin-C; sh, short hairpin; NC, negative control.

