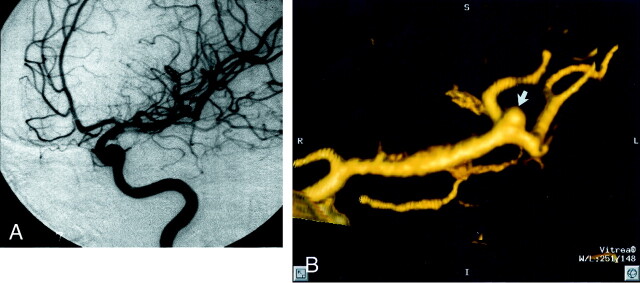
Fig 5.
Patient 25, aneurysm 41. Example of high correlation between DSA and 3D CTA.
A, Midarterial phase anteroposterior oblique projection DSA image of the left MCA shows a small MCA bifurcation aneurysm (arrow).
B, 3D CTA image, obtained in a projection similar to that of the DSA image shown in A, shows a 1.9-mm maximal diameter saccular aneurysm arising from the left MCA bifurcation (arrow).

