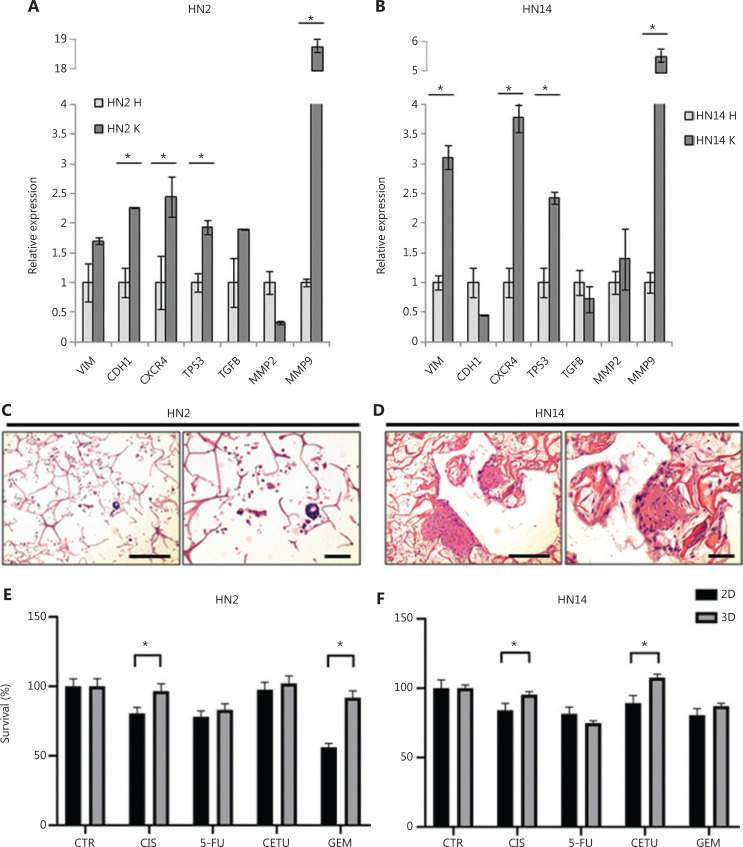
Figure 5.
Drug-resistance mechanisms are also conserved in HNC patient-derived primary cultures. (A, B) VIM, CDH1, CXCR4, TP53, TGFβ, MMP2, and MMP9 gene expression analysis in patient tumor tissue (HN2 K and HN14 K) vs. healthy tissue (HN2 H and HN14 H). Data represent mean ± standard deviation. *P < 0.05, 2-tailed Student’s t-test. (C, D) Images of H&E-stained histological sections of HN2 and HN14 3D primary cultures. From left: H&E images at 10× magnification (scale bars: 100 µm) and 20× magnification (scale bars: 50 µm). (E, F) Cytotoxic analysis of HN2 and HN14 primary cultures. 2D and 3D cultures were treated with CIS, 5-FU, CETU, and GEM. Differences between 2D and 3D cultures were assessed by a 2-tailed Student’s t-test and accepted as significant (*) at P < 0.05. HNC, head and neck carcinoma; H&E, hematoxylin and eosin; 3D, 3-dimensional; 2D, 2-dimensional; CIS, cisplatin; 5-FU, 5-fluorouracil; CETU, cetuximab; GEM, gemcitabine.

