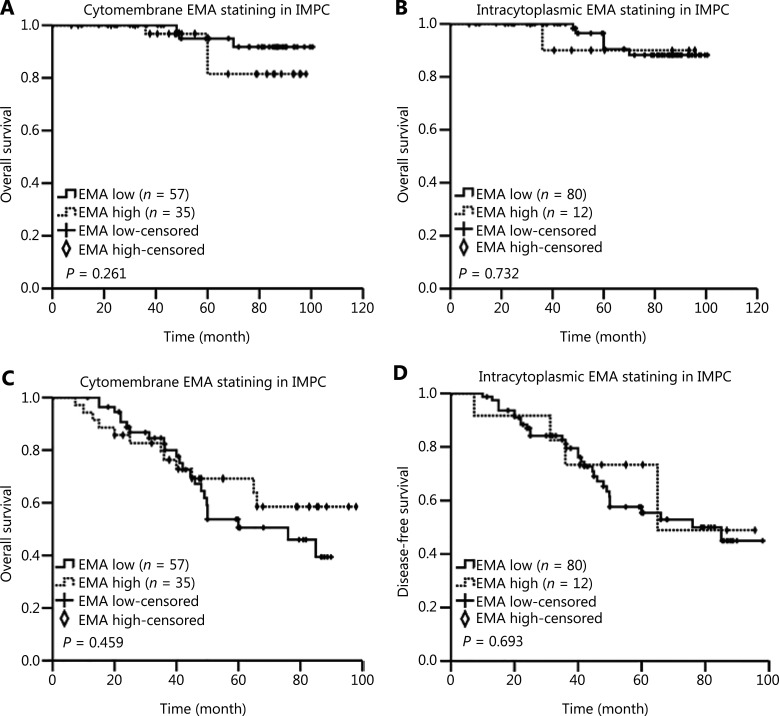
Figure 4.
Kaplan-Meier curves showing the prognostic value of EMA expression in patients with IMPC. Kaplan-Meier curve for (A) OS and (C) DFS, based on the cytomembrane expression of EMA. (B) OS and (D) DFS, based on the intracytoplasmic expression of EMA. P-values were calculated with the log-rank test. Eight patients were lost to follow-up.

