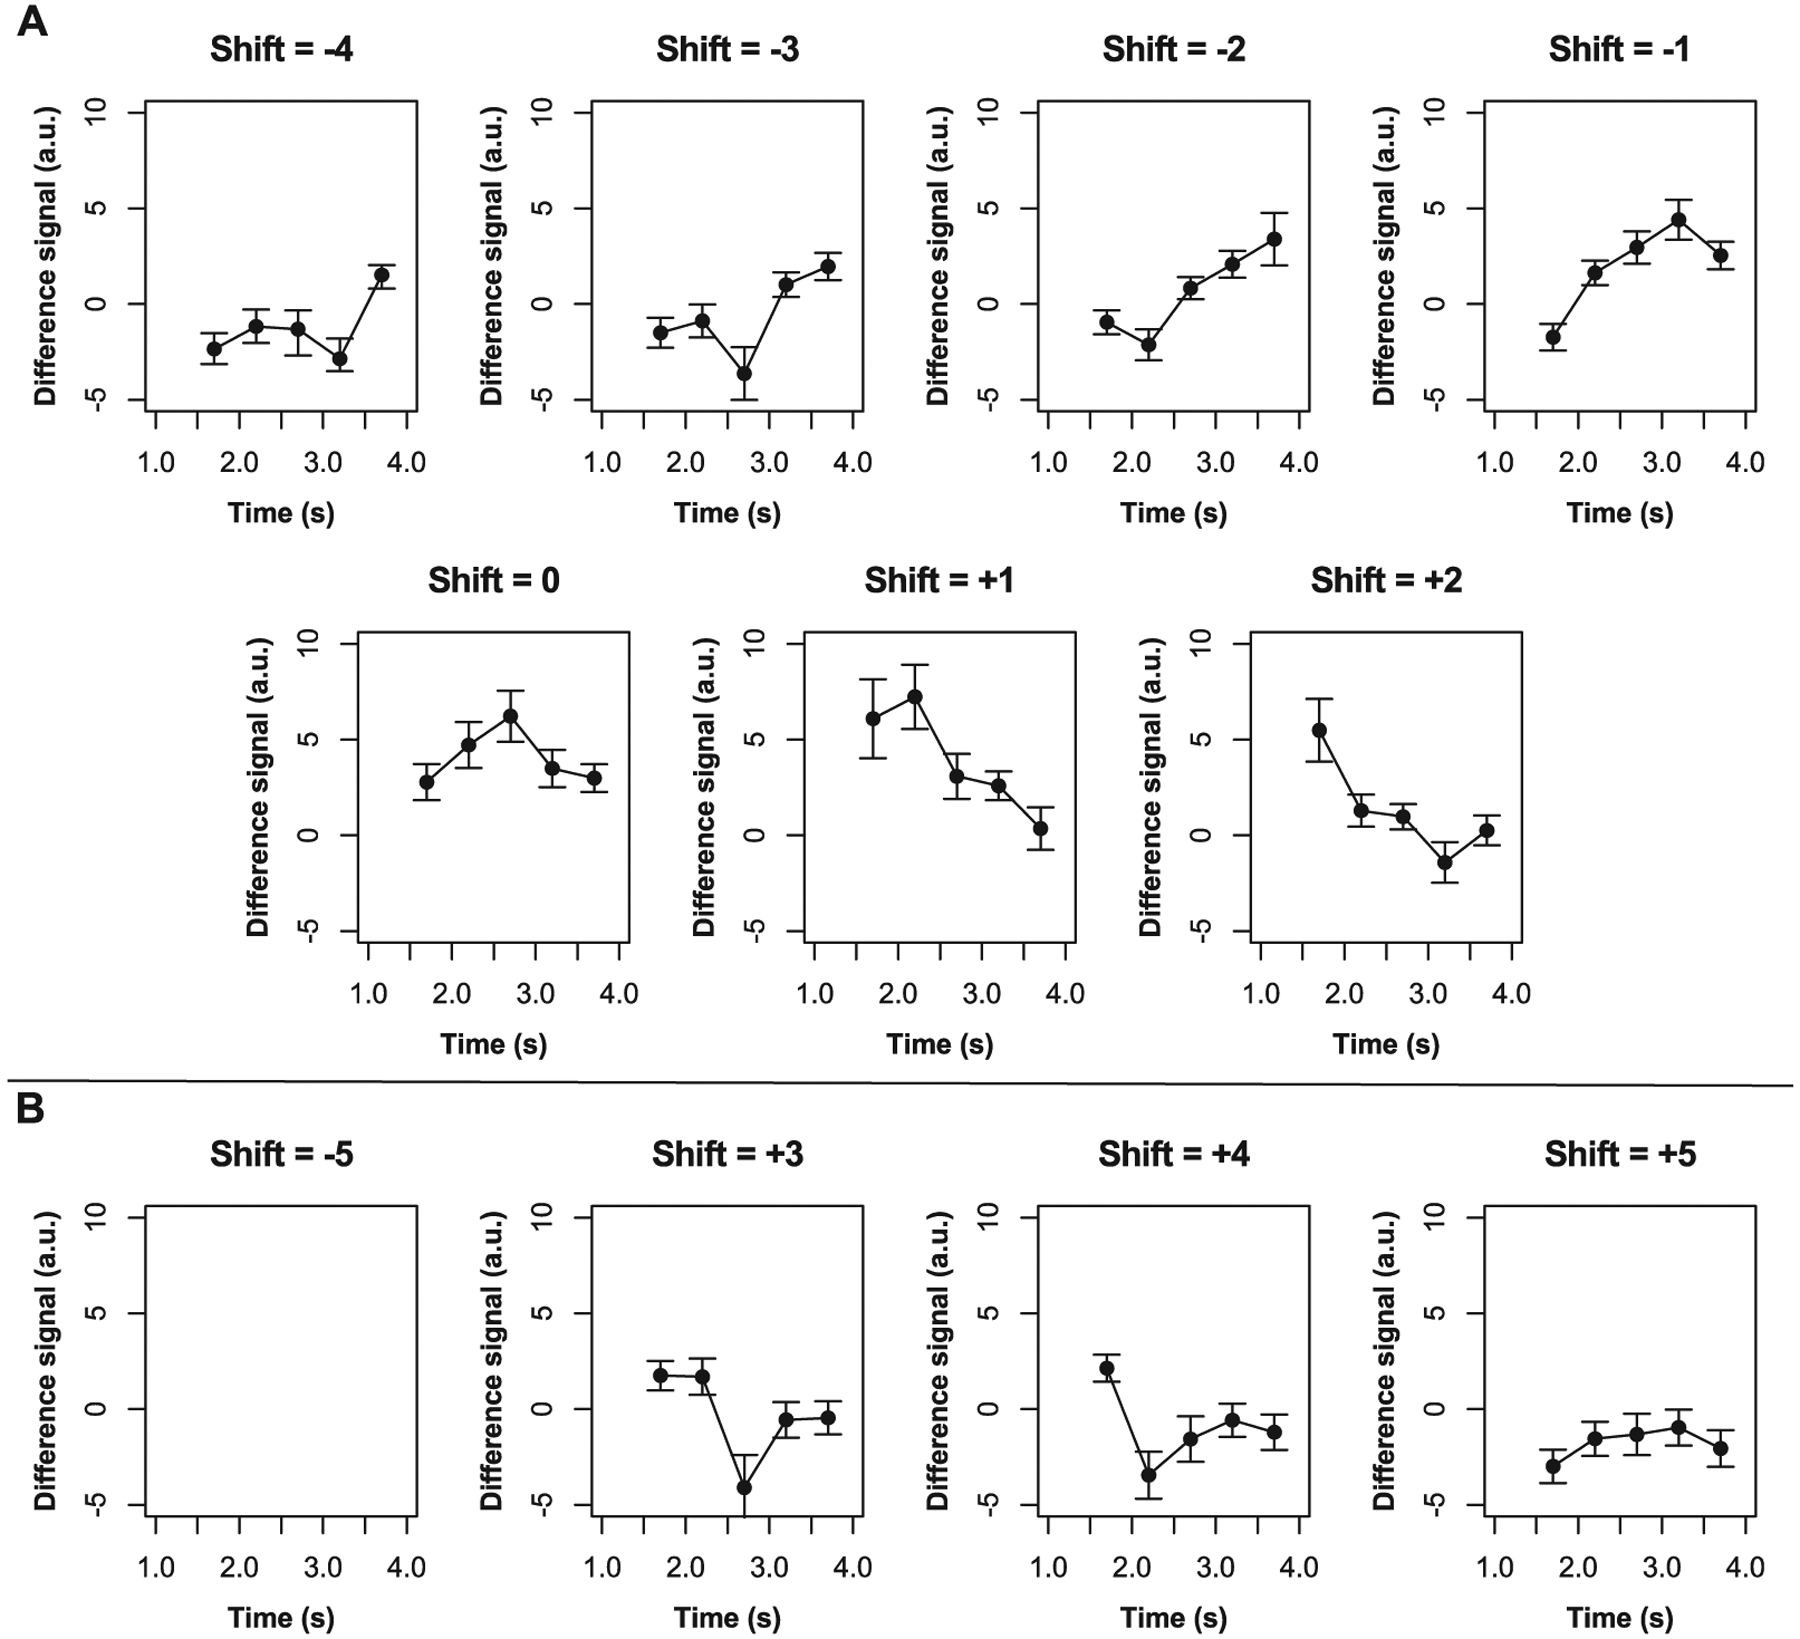
Fig. 2. Signal time courses at various shift indices.

Mean control-label difference signal time courses are shown here across participants for time shifts − 5 to + 5. Error bars represent one standard deviation from the mean.

Mean control-label difference signal time courses are shown here across participants for time shifts − 5 to + 5. Error bars represent one standard deviation from the mean.