
Figure 1. Cell-specific GluA2 overexpression disrupts AMPA-dependent calcium response in OPCs.
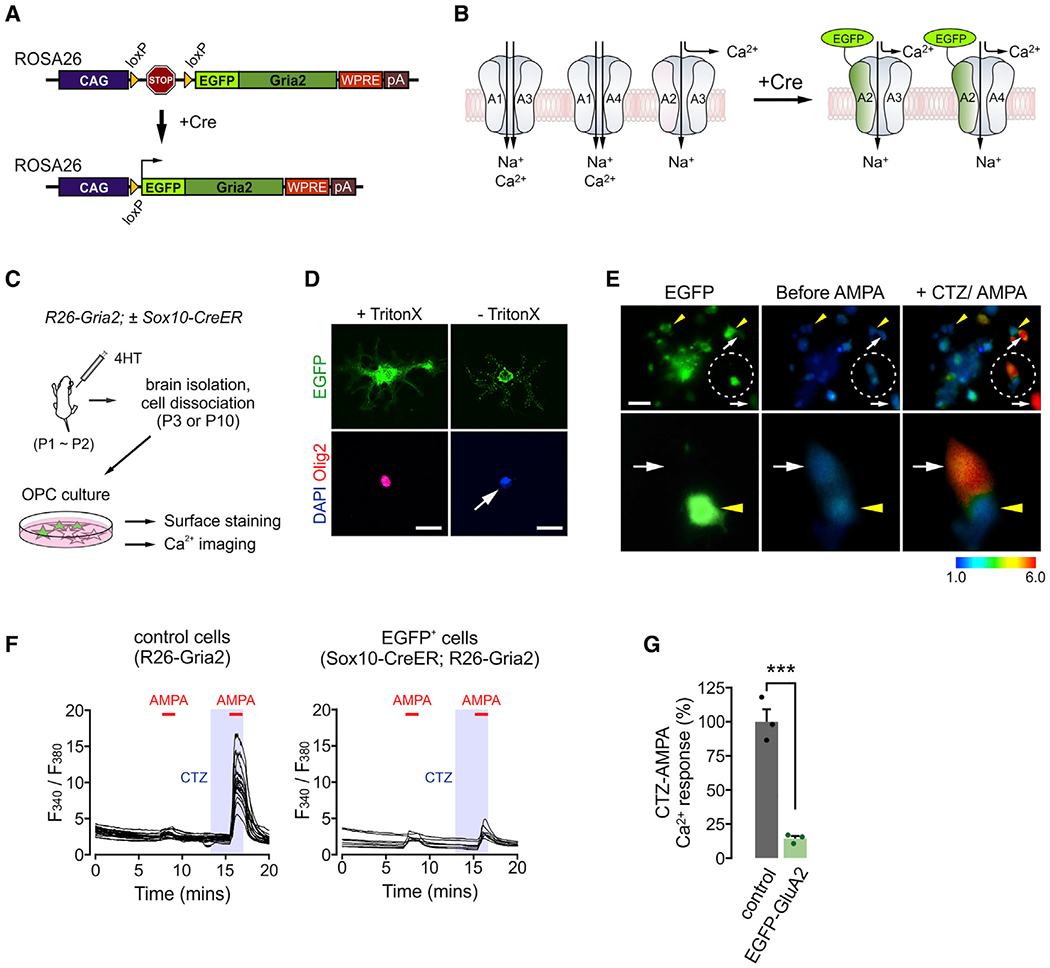
(A) Diagram of CAG-loxP-STOP-loxP-EGFP-Gria2 transgene placed on the Rosa26 locus.
(B) Expected outcomes after insertion of overexpressed EGFP-GluA2 into the cell membrane. Presence of calcium-impermeable of GluA2 in AMPAR complexes may block calcium entry through AMPARs, regardless of subunit composition. A1–A4 are GluA1–GluA4, respectively.
(C) Illustration of experiments for EGFP-GluA2 validation. After 4HT injections (0.2 mg per subcutaneous [s.c.] injection, at P1 and P2), R26-Gria2 ± Sox10-CreER mice were killed at P3 (calcium imaging) or P10 (immunopanning and surface detection of EGFP).
(D) Immunodetection of EGFP expressed on the cell surface. OPCs were isolated via immunopanning from 4HT-administered Sox10-CreER;R26-Gria2 mice and stained for EGFP and Olig2 with or without Triton X-100 for permeabilization. After secondary antibody probing, cells were permeabilized for DAPI staining. White arrow highlights no Olig2 detection. Scale bars: 25 μm.
(E) Upper panel: images of cultured EGFP+ OPCs (left) and their calcium responses before (center) and after CTZ (100 μM) + AMPA (20 μM) (right). Lower panel: enlarged views of 2 adjacent cells (EGFP+ and EGFP− OPCs) in the circled area of the upper panel. Yellow arrowheads and white arrows indicate EGFP+ and EGFP− cells, respectively. Scale bar: 50μm.
(F) Traces of the calcium responses of individual cells as ratios of fluorescence collected after excitation at 340 and 380 nm. Red bars and shaded regions represent durations of AMPA (1 min) and CTZ (2.5 min) applications, respectively. Calcium responses of OPCs collected from an R26-Gria2 (left) and EGFP+ OPCs from a Sox10-CreER; R26-Gria2 mouse (right).
(G) EGFP-GluA2 attenuates CTZ + AMPA-elicited calcium responses in OPCs. Peak responses averaged over all cells for each coverslip. n = 3 coverslips per group. Data are represented as means ± SEMs. Unpaired Student’s t test. ***p < 0.001.
See also Figures S1 and S2.