
Figure 4. GluA2 overexpression increases OPC proliferation in the adult brain.
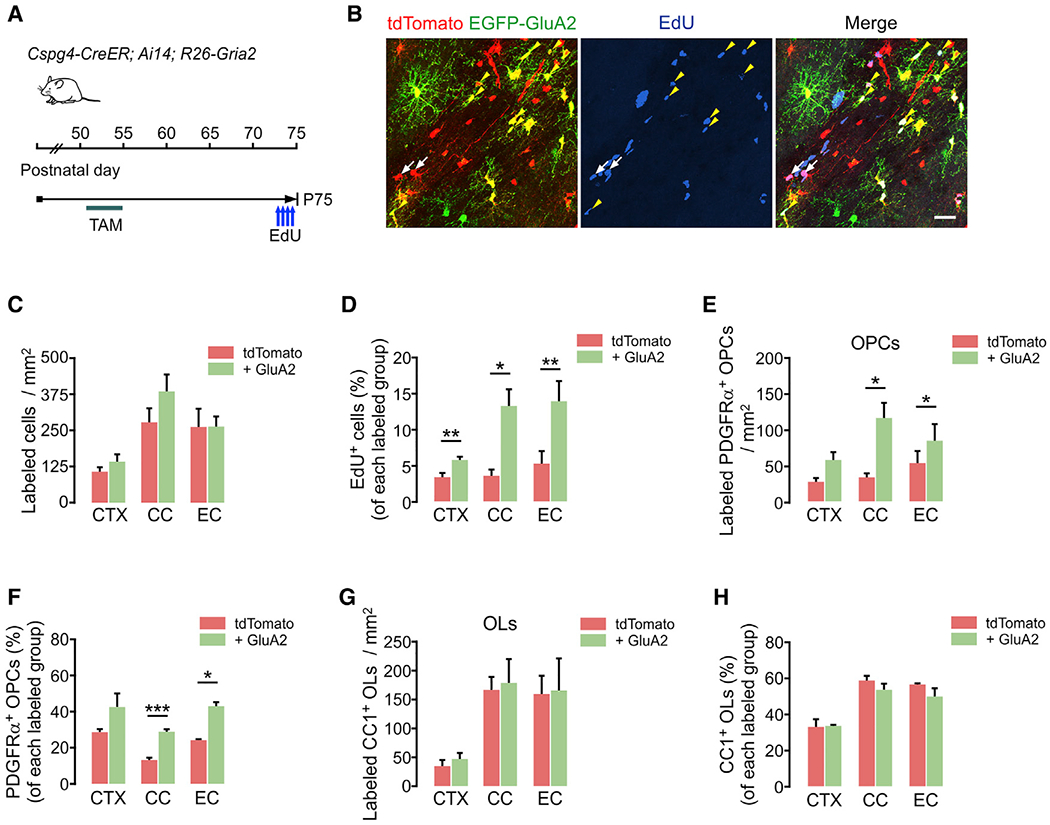
(A) Timeline for tamoxifen and EdU injections and sampling of Cspg4-CreER; Ai14; R26-Gria2 mice. Tamoxifen was injected (40 mg/kg per i.p. injection) 10 times between P51 and P55, and mice were sampled at P75. EdU was injected 4 times over 2 days before sampling.
(B) Confocal images of EdU-incorporated tdTomato+ or E-A2 cells in EC. White arrows and yellow arrowheads indicate EdU+ tdTomato+ EGFP− (control) and EdU+ E-2A (+ GluA2) cells, respectively. Scale bar: 25 μm.
(C) Densities of tdTomato+ (control) and E-2A (+ GluA2) cells (control versus + GluA2 group, CTX: p = 0.11; CC: p = 0.26; EC: p = 0.99).
(D) Percentages of EdU+ cells among tdTomato+ (control) and E-A2 cells (+ GluA2) (control versus + GluA2 group, CTX: p = 0.0084; CC: p = 0.021; EC: p = 0.0091).
(E) Densities of tdTomato+ PDGFRα+ OPCs with or without EGFP-GluA2 expression (control versus + GluA2 group, CTX: p = 0.069; CC: p = 0.048; EC: p = 0.047).
(F) Percentages of OPCs among tdTomato+ (control) and E-A2 cells (+ GluA2) (control versus + GluA2 group, CTX: p = 0.18; CC: p = 0.0009; EC: p = 0.017).
(G) Densities of tdTomato+ CC1+ OLs with or without EGFP-GluA2 expression (control versus + GluA2 group, CTX: p = 0.41; CC: p = 0.84; EC: p = 0.93).
(H) Percentages of OLs among tdTomato+ (control) and E-A2 cells (+ GluA2) (control versus + GluA2 group, CTX: p = 0.89; CC: p = 0.25; EC: p = 0.23).
Data are represented as means ± SEMs, n = 4 mice (C–H). Paired Student’s t test for (C–H). *p < 0.05, **p < 0.01, and ***p < 0.001.