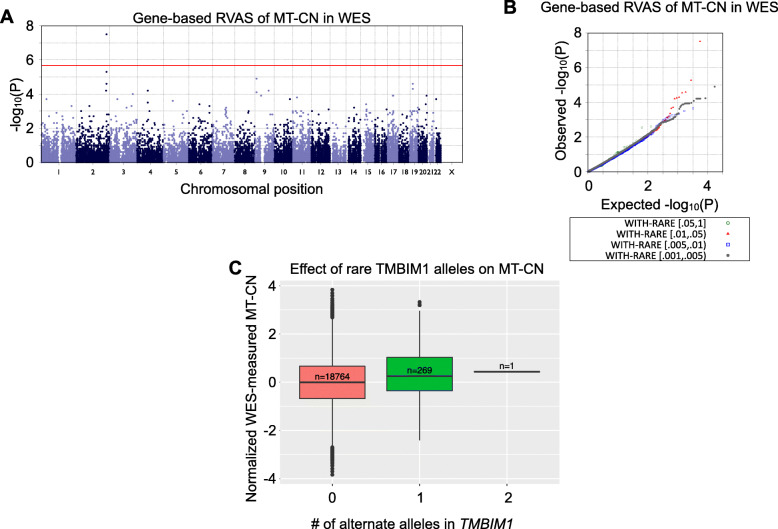
Fig. 3.
Gene-based associations with MT-CN in WES data. A Manhattan plot and quantile–quantile (QQ) plot for a gene-based rare variant association test of normalized, WES-measured MT-CN using WES data from both METSIM and FINRISK (N = 19034). The red line represents a Bonferroni significance level of 2.164 × 10⁻⁶, as 23105 genes were included in this test. TMBIM1 is the only gene to reach significance at this level. B QQ plot for the test shown in A. This plot is separated by minor allele frequency bin, as indicated by the colors and shapes of the points. C Boxplot showing the distributions of normalized WES-measured MT-CN, separated by the number of WES-detected alternate alleles in TMBIM1 with MAF < 0.01 and CADD score > 20 (N = 19034)

