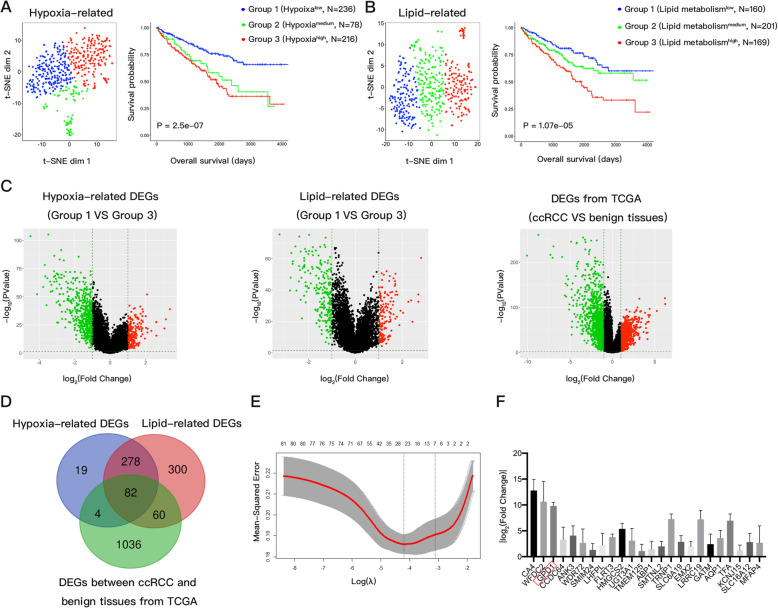
Fig. 1.
GPD1 serves an important role in hypoxia and lipid metabolism pathways in ccRCC. (A) Dot plots for groups (1–3) identified by a t-SNE algorithm based on hypoxic hallmark genes and Kaplan-Meier plots for overall survival. (B) Dot plots for groups (1–3) identified by a t-SNE algorithm based on lipid metabolism hallmark genes and Kaplan-Meier plots for overall survival. (C) Heatmaps showing expression profiles for hypoxia-related DEGs, lipid-related DEGs, and DEGs between ccRCC and benign kidney tissues in the TCGA database. (D) A Venn diagram showing overlapping hypoxia-related DEGs, lipid-related DEGs, and DEGs between ccRCC and benign kidney tissues in the TCGA database. (E) LASSO Cox regression model that selected 24 prognostic hypoxia-lipid-related DEGs. (F) Alterations in mRNA levels of 24 prognostic hypoxia-lipid-related DEGs under hypoxic conditions. Abbreviations: GPD1, glycerol-3-phosphate dehydrogenase 1; ccRCC, clear cell renal cell carcinoma; t-SNE, t-distributed stochastic neighbor embedding; DEGs, differently expressed genes; TCGA, The Cancer Genome Atlas; LASSO, least absolute shrinkage and selection operator

