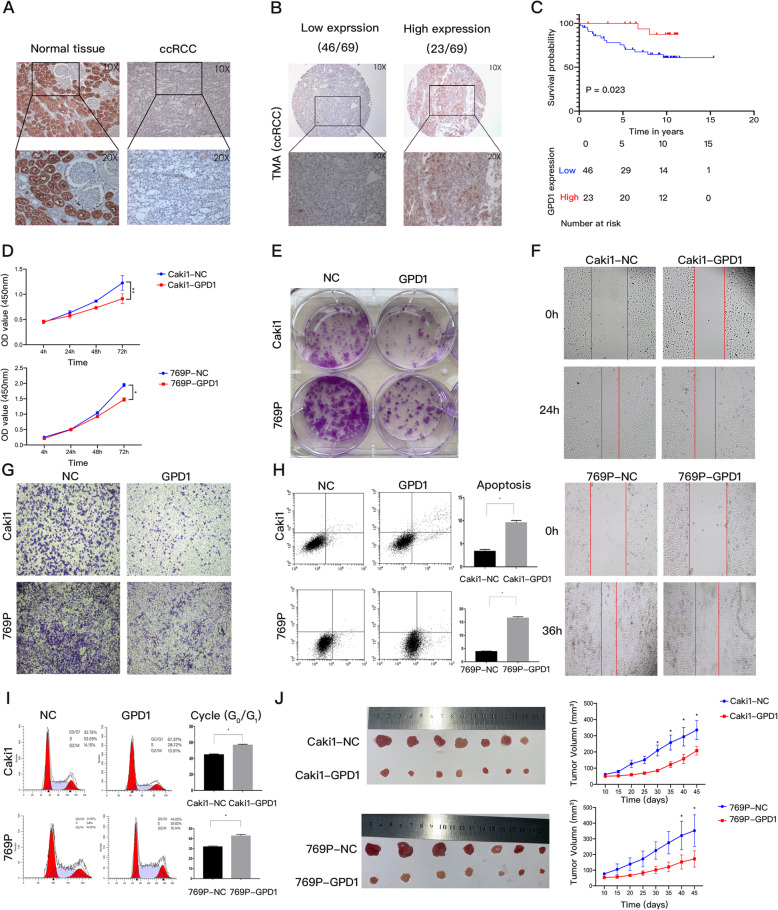
Fig. 2.
The expression of GPD1 was downregulated in ccRCC tissues and inhibited the progression of ccRCC in vitro and in vivo. (A) Immunostainings of GPD1 protein in ccRCC tissues and paired normal kidney tissues. (B) Immunostainings of GPD1 protein in 69 ccRCC samples of TMA. (C) Kaplan-Meier curves for overall survival between the GPD1 high-expression group and the GPD1 low-expression group based on GPD1 IHC scores (8–12, GPD1 high-expression, n = 23 vs. 0–6, GPD1 low-expression, n = 46). (D-E) Cell proliferation as determined by CCK-8 and colony formation assays. (F-G) Cell migration and invasion as determined by wound healing and Transwell assays. Red lines denote the margins of the wound. (H) Cell apoptosis analysis of Caki1 and 769P cells overexpressing GPD1 or a negative control. (I) Cell cycle analysis of Caki1 and 769P cells overexpressing GPD1 or a negative control. The results are presented as the mean + SD of three independent experiments. (J) Images of tumors from the subcutaneous xenograft models implanted using Caki1 and 769P cells that stably overexpressed GPD1 or a negative control. The growth curves of tumors are shown (*p < 0.05, **p < 0.01). Abbreviations: GPD1, glycerol-3-phosphate dehydrogenase 1; ccRCC, clear cell renal cell carcinoma; TMA, tissue microarray; IHC, immunohistochemistry; TCGA, the cancer genome atlas; CCK-8, cell counting kit

