Fig. 4.
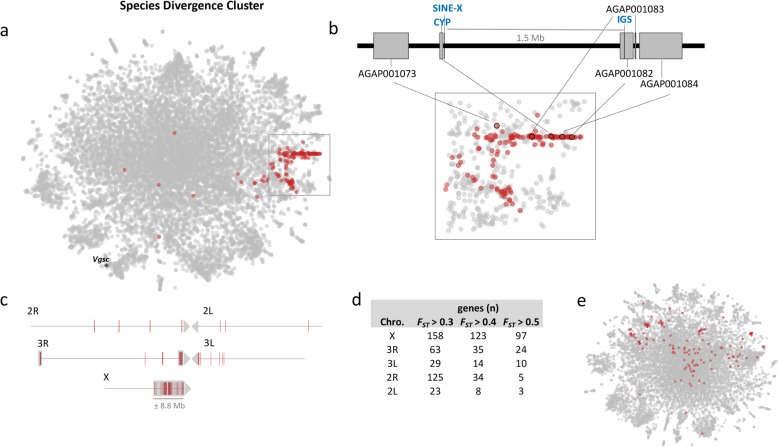
Sibling species differentiation. a t-SNE plot highlighting genes that show two criteria: Species FST higher than General FST and Species FST values higher than 0.5 (red). These genes are largely located either on the centromeric half of the X chromosome or close to the 3R centromere. In black, gene Vgsc (AGAP004707). b Enlargement of the ‘speciation cluster’ showing neighboring genes (AGAP001073, AGAP001082, AGAP001083, AGAP001084) of the main diagnostic markers of A. gambiae and A. coluzzii: IGS, SINE200 and CYP (in blue). c Schematic representation of gene starting point for every gene selected in a; shaded area corresponds to previously described islands of speciation. d Table containing the distribution of genes through chromosome arms in the ‘speciation cluster’. e Scatter plot of the same 11,318 genes of A. gambiae genome using only An. gambiae s.s. samples, showing loss of a defined ‘speciation cluster’

